
 Yahoo Finance
 Can Mixed Fundamentals Have A Negative Impact on NEXTDC Limited (ASX:NXT) Current Share Price Momentum?
NEXTDC (ASX:NXT) has had a great run on the share market with its stock up by a significant 19% over the last three months. However, we wonder if the company's inconsistent financials would have any adverse impact on the current share price momentum. Particularly, we will be paying attention to NEXTDC's ROE today.
Return on equity or ROE is a key measure used to assess how efficiently a company's management is utilizing the company's capital. In other words, it is a profitability ratio which measures the rate of return on the capital provided by the company's shareholders.
Check out our latest analysis for NEXTDC
How Is ROE Calculated?
ROE can be calculated by using the formula:
Return on Equity = Net Profit (from continuing operations) ÷ Shareholders' Equity
So, based on the above formula, the ROE for NEXTDC is:
0.5% = AU$9.1m ÷ AU$1.7b (Based on the trailing twelve months to June 2022).
The 'return' refers to a company's earnings over the last year. That means that for every A$1 worth of shareholders' equity, the company generated A$0.01 in profit.
What Is The Relationship Between ROE And Earnings Growth?
Thus far, we have learned that ROE measures how efficiently a company is generating its profits. We now need to evaluate how much profit the company reinvests or "retains" for future growth which then gives us an idea about the growth potential of the company. Assuming everything else remains unchanged, the higher the ROE and profit retention, the higher the growth rate of a company compared to companies that don't necessarily bear these characteristics.
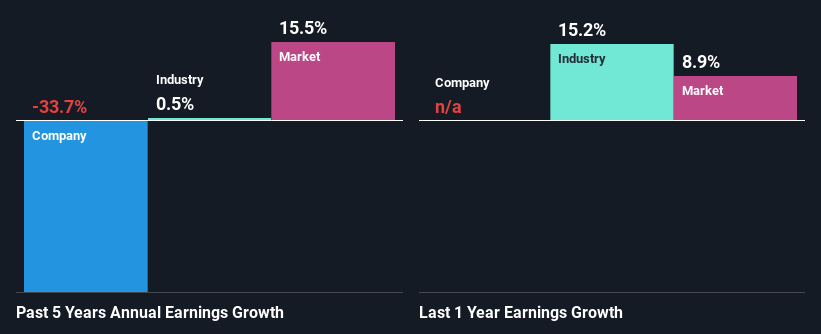
A Side By Side comparison of NEXTDC's Earnings Growth And 0.5% ROE
It is quite clear that NEXTDC's ROE is rather low. Not just that, even compared to the industry average of 20%, the company's ROE is entirely unremarkable. Given the circumstances, the significant decline in net income by 34% seen by NEXTDC over the last five years is not surprising. We believe that there also might be other aspects that are negatively influencing the company's earnings prospects. For instance, the company has a very high payout ratio, or is faced with competitive pressures.
So, as a next step, we compared NEXTDC's performance against the industry and were disappointed to discover that while the company has been shrinking its earnings, the industry has been growing its earnings at a rate of 0.5% in the same period.
The basis for attaching value to a company is, to a great extent, tied to its earnings growth. It’s important for an investor to know whether the market has priced in the company's expected earnings growth (or decline). By doing so, they will have an idea if the stock is headed into clear blue waters or if swampy waters await. One good indicator of expected earnings growth is the P/E ratio which determines the price the market is willing to pay for a stock based on its earnings prospects. So, you may want to check if NEXTDC is trading on a high P/E or a low P/E, relative to its industry.
Is NEXTDC Making Efficient Use Of Its Profits?
Because NEXTDC doesn't pay any dividends, we infer that it is retaining all of its profits, which is rather perplexing when you consider the fact that there is no earnings growth to show for it. So there might be other factors at play here which could potentially be hampering growth. For example, the business has faced some headwinds.
Summary
On the whole, we feel that the performance shown by NEXTDC can be open to many interpretations. While the company does have a high rate of reinvestment, the low ROE means that all that reinvestment is not reaping any benefit to its investors, and moreover, its having a negative impact on the earnings growth. With that said, we studied the latest analyst forecasts and found that while the company has shrunk its earnings in the past, analysts expect its earnings to grow in the future. To know more about the company's future earnings growth forecasts take a look at this free report on analyst forecasts for the company to find out more.
Have feedback on this article? Concerned about the content? Get in touch with us directly. Alternatively, email editorial-team (at) simplywallst.com.
This article by Simply Wall St is general in nature. We provide commentary based on historical data and analyst forecasts only using an unbiased methodology and our articles are not intended to be financial advice. It does not constitute a recommendation to buy or sell any stock, and does not take account of your objectives, or your financial situation. We aim to bring you long-term focused analysis driven by fundamental data. Note that our analysis may not factor in the latest price-sensitive company announcements or qualitative material. Simply Wall St has no position in any stocks mentioned.
Join A Paid User Research Session
You’ll receive a US$30 Amazon Gift card for 1 hour of your time while helping us build better investing tools for the individual investors like yourself. Sign up here
