
 Yahoo Finance
 Can Mixed Fundamentals Have A Negative Impact on James Fisher and Sons plc (LON:FSJ) Current Share Price Momentum?
James Fisher and Sons' (LON:FSJ) stock is up by a considerable 9.9% over the past month. However, we wonder if the company's inconsistent financials would have any adverse impact on the current share price momentum. In this article, we decided to focus on James Fisher and Sons' ROE.
Return on equity or ROE is a key measure used to assess how efficiently a company's management is utilizing the company's capital. In simpler terms, it measures the profitability of a company in relation to shareholder's equity.
Check out our latest analysis for James Fisher and Sons
How Is ROE Calculated?
ROE can be calculated by using the formula:
Return on Equity = Net Profit (from continuing operations) ÷ Shareholders' Equity
So, based on the above formula, the ROE for James Fisher and Sons is:
4.1% = UK£9.0m ÷ UK£218m (Based on the trailing twelve months to December 2022).
The 'return' is the amount earned after tax over the last twelve months. That means that for every £1 worth of shareholders' equity, the company generated £0.04 in profit.
What Is The Relationship Between ROE And Earnings Growth?
So far, we've learned that ROE is a measure of a company's profitability. We now need to evaluate how much profit the company reinvests or "retains" for future growth which then gives us an idea about the growth potential of the company. Assuming all else is equal, companies that have both a higher return on equity and higher profit retention are usually the ones that have a higher growth rate when compared to companies that don't have the same features.
A Side By Side comparison of James Fisher and Sons' Earnings Growth And 4.1% ROE
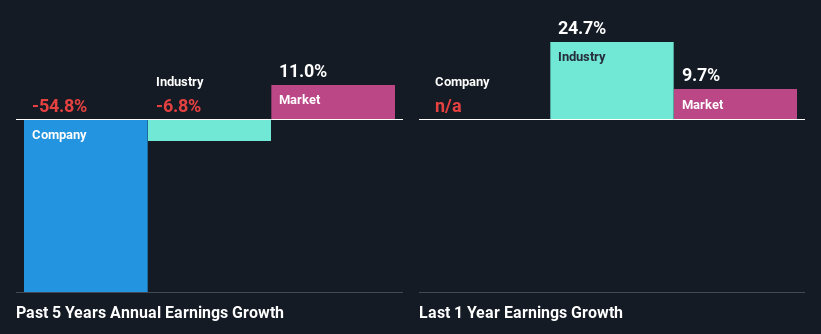
At first glance, James Fisher and Sons' ROE doesn't look very promising. We then compared the company's ROE to the broader industry and were disappointed to see that the ROE is lower than the industry average of 11%. For this reason, James Fisher and Sons' five year net income decline of 55% is not surprising given its lower ROE. However, there could also be other factors causing the earnings to decline. For example, it is possible that the business has allocated capital poorly or that the company has a very high payout ratio.
So, as a next step, we compared James Fisher and Sons' performance against the industry and were disappointed to discover that while the company has been shrinking its earnings, the industry has been growing its earnings at a rate of 0.5% in the same period.
Earnings growth is a huge factor in stock valuation. It’s important for an investor to know whether the market has priced in the company's expected earnings growth (or decline). By doing so, they will have an idea if the stock is headed into clear blue waters or if swampy waters await. One good indicator of expected earnings growth is the P/E ratio which determines the price the market is willing to pay for a stock based on its earnings prospects. So, you may want to check if James Fisher and Sons is trading on a high P/E or a low P/E, relative to its industry.
Is James Fisher and Sons Making Efficient Use Of Its Profits?
James Fisher and Sons doesn't pay any dividend, meaning that potentially all of its profits are being reinvested in the business, which doesn't explain why the company's earnings have shrunk if it is retaining all of its profits. So there might be other factors at play here which could potentially be hampering growth. For example, the business has faced some headwinds.
Summary
On the whole, we feel that the performance shown by James Fisher and Sons can be open to many interpretations. While the company does have a high rate of reinvestment, the low ROE means that all that reinvestment is not reaping any benefit to its investors, and moreover, its having a negative impact on the earnings growth. With that said, we studied the latest analyst forecasts and found that while the company has shrunk its earnings in the past, analysts expect its earnings to grow in the future. Are these analysts expectations based on the broad expectations for the industry, or on the company's fundamentals? Click here to be taken to our analyst's forecasts page for the company.
Have feedback on this article? Concerned about the content? Get in touch with us directly. Alternatively, email editorial-team (at) simplywallst.com.
This article by Simply Wall St is general in nature. We provide commentary based on historical data and analyst forecasts only using an unbiased methodology and our articles are not intended to be financial advice. It does not constitute a recommendation to buy or sell any stock, and does not take account of your objectives, or your financial situation. We aim to bring you long-term focused analysis driven by fundamental data. Note that our analysis may not factor in the latest price-sensitive company announcements or qualitative material. Simply Wall St has no position in any stocks mentioned.
Join A Paid User Research Session
You’ll receive a US$30 Amazon Gift card for 1 hour of your time while helping us build better investing tools for the individual investors like yourself. Sign up here
