
 Yahoo Finance
 Mission Group (LON:TMG) Could Be Struggling To Allocate Capital
To find a multi-bagger stock, what are the underlying trends we should look for in a business? Firstly, we'd want to identify a growing return on capital employed (ROCE) and then alongside that, an ever-increasing base of capital employed. Basically this means that a company has profitable initiatives that it can continue to reinvest in, which is a trait of a compounding machine. In light of that, when we looked at Mission Group (LON:TMG) and its ROCE trend, we weren't exactly thrilled.
Return On Capital Employed (ROCE): What Is It?
Just to clarify if you're unsure, ROCE is a metric for evaluating how much pre-tax income (in percentage terms) a company earns on the capital invested in its business. The formula for this calculation on Mission Group is:
Return on Capital Employed = Earnings Before Interest and Tax (EBIT) ÷ (Total Assets - Current Liabilities)
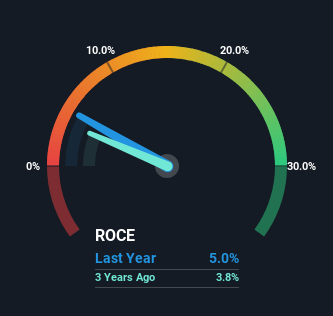
0.05 = UK£6.6m ÷ (UK£186m - UK£54m) (Based on the trailing twelve months to June 2023).
Thus, Mission Group has an ROCE of 5.0%. Ultimately, that's a low return and it under-performs the Media industry average of 11%.
Check out our latest analysis for Mission Group
In the above chart we have measured Mission Group's prior ROCE against its prior performance, but the future is arguably more important. If you're interested, you can view the analysts predictions in our free report on analyst forecasts for the company.
The Trend Of ROCE
On the surface, the trend of ROCE at Mission Group doesn't inspire confidence. To be more specific, ROCE has fallen from 7.6% over the last five years. However, given capital employed and revenue have both increased it appears that the business is currently pursuing growth, at the consequence of short term returns. If these investments prove successful, this can bode very well for long term stock performance.
In Conclusion...
Even though returns on capital have fallen in the short term, we find it promising that revenue and capital employed have both increased for Mission Group. And there could be an opportunity here if other metrics look good too, because the stock has declined 54% in the last five years. So we think it'd be worthwhile to look further into this stock given the trends look encouraging.
If you want to know some of the risks facing Mission Group we've found 2 warning signs (1 is potentially serious!) that you should be aware of before investing here.
While Mission Group isn't earning the highest return, check out this free list of companies that are earning high returns on equity with solid balance sheets.
Have feedback on this article? Concerned about the content? Get in touch with us directly. Alternatively, email editorial-team (at) simplywallst.com.
This article by Simply Wall St is general in nature. We provide commentary based on historical data and analyst forecasts only using an unbiased methodology and our articles are not intended to be financial advice. It does not constitute a recommendation to buy or sell any stock, and does not take account of your objectives, or your financial situation. We aim to bring you long-term focused analysis driven by fundamental data. Note that our analysis may not factor in the latest price-sensitive company announcements or qualitative material. Simply Wall St has no position in any stocks mentioned.
