
 Yahoo Finance
 How Millrock Resources Inc (CVE:MRO) Can Impact Your Portfolio Volatility

If you’re interested in Millrock Resources Inc (CVE:MRO), then you might want to consider its beta (a measure of share price volatility) in order to understand how the stock could impact your portfolio. Modern finance theory considers volatility to be a measure of risk, and there are two main types of price volatility. First, we have company specific volatility, which is the price gyrations of an individual stock. Holding at least 8 stocks can reduce this kind of risk across a portfolio. The second type is the broader market volatility, which you cannot diversify away, since it arises from macroeconomic factors which directly affects all the stocks on the market.
Some stocks see their prices move in concert with the market. Others tend towards stronger, gentler or unrelated price movements. Beta can be a useful tool to understand how much a stock is influenced by market risk (volatility). However, Warren Buffett said ‘volatility is far from synonymous with risk’ in his 2014 letter to investors. So, while useful, beta is not the only metric to consider. To use beta as an investor, you must first understand that the overall market has a beta of one. Any stock with a beta of greater than one is considered more volatile than the market, while those with a beta below one are either less volatile or poorly correlated with the market.
See our latest analysis for Millrock Resources
What MRO’s beta value tells investors
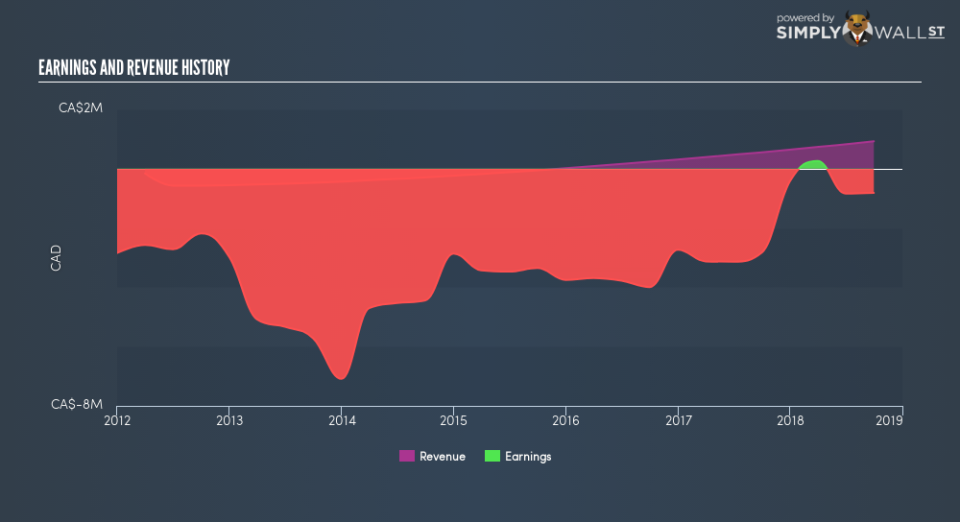
Zooming in on Millrock Resources, we see it has a five year beta of 1.72. This is above 1, so historically its share price has been influenced by the broader volatility of the stock market the market. If the past is any guide, we would expect that Millrock Resources shares will rise quicker than the markets in times of optimism, but fall faster in times of pessimism. Share price volatility is well worth considering, but most long term investors consider the history of revenue and earnings growth to be more important. Take a look at how Millrock Resources fares in that regard, below.
Could MRO’s size cause it to be more volatile?
Millrock Resources is a rather small company. It has a market capitalisation of CA$6.9m, which means it is probably under the radar of most investors. It takes less money to influence the share price of a very small company. This may explain the excess volatility implied by this beta value.
What this means for you:
Since Millrock Resources has a reasonably high beta, it’s worth considering why it is so heavily influenced by broader market sentiment. For example, it might be a high growth stock or have a lot of operating leverage in its business model. This article aims to educate investors about beta values, but it’s well worth looking at important company-specific fundamentals such as Millrock Resources’s financial health and performance track record. I highly recommend you dive deeper by considering the following:
Financial Health: Are MRO’s operations financially sustainable? Balance sheets can be hard to analyze, which is why we’ve done it for you. Check out our financial health checks here.
Past Track Record: Has MRO been consistently performing well irrespective of the ups and downs in the market? Go into more detail in the past performance analysis and take a look at the free visual representations of MRO’s historicals for more clarity.
Other High-Performing Stocks: Are there other stocks that provide better prospects with proven track records? Explore our free list of these great stocks here.
To help readers see past the short term volatility of the financial market, we aim to bring you a long-term focused research analysis purely driven by fundamental data. Note that our analysis does not factor in the latest price-sensitive company announcements.
The author is an independent contributor and at the time of publication had no position in the stocks mentioned. For errors that warrant correction please contact the editor at editorial-team@simplywallst.com.
