
 Yahoo Finance
 You Might Like Great Canadian Gaming Corporation (TSE:GC) But Do You Like Its Debt?

Want to participate in a short research study? Help shape the future of investing tools and you could win a $250 gift card!
While small-cap stocks, such as Great Canadian Gaming Corporation (TSE:GC) with its market cap of CA$2.6b, are popular for their explosive growth, investors should also be aware of their balance sheet to judge whether the company can survive a downturn. Assessing first and foremost the financial health is vital, as mismanagement of capital can lead to bankruptcies, which occur at a higher rate for small-caps. We'll look at some basic checks that can form a snapshot the company’s financial strength. However, this is not a comprehensive overview, so I’d encourage you to dig deeper yourself into GC here.
Does GC Produce Much Cash Relative To Its Debt?
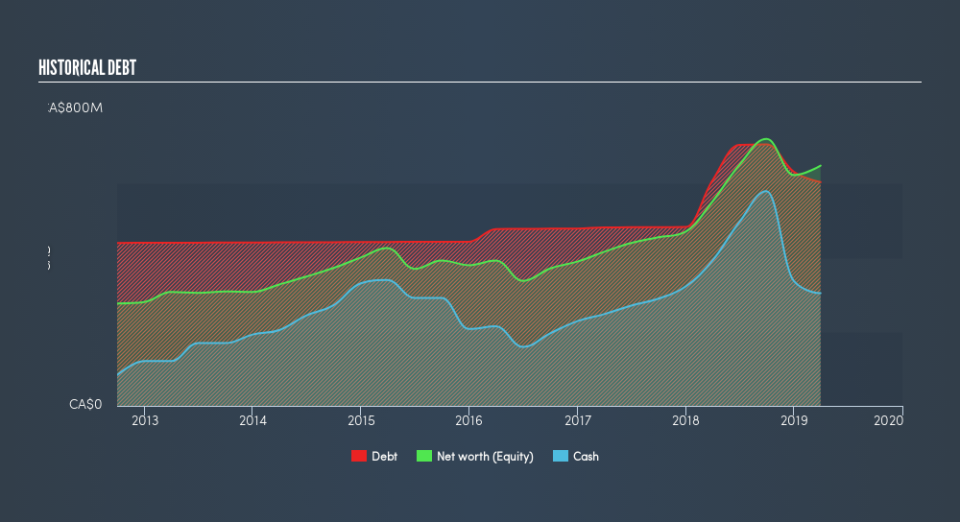
GC's debt levels surged from CA$608m to CA$1.5b over the last 12 months – this includes long-term debt. With this growth in debt, GC currently has CA$304m remaining in cash and short-term investments to keep the business going. On top of this, GC has generated cash from operations of CA$431m during the same period of time, resulting in an operating cash to total debt ratio of 28%, meaning that GC’s current level of operating cash is high enough to cover debt.
Does GC’s liquid assets cover its short-term commitments?
At the current liabilities level of CA$281m, it appears that the company has maintained a safe level of current assets to meet its obligations, with the current ratio last standing at 1.48x. The current ratio is the number you get when you divide current assets by current liabilities. For Hospitality companies, this ratio is within a sensible range since there's a sufficient cash cushion without leaving too much capital idle or in low-earning investments.
Does GC face the risk of succumbing to its debt-load?
With debt reaching 93% of equity, GC may be thought of as relatively highly levered. This is a bit unusual for a small-cap stock, since they generally have a harder time borrowing than large more established companies. We can test if GC’s debt levels are sustainable by measuring interest payments against earnings of a company. Ideally, earnings before interest and tax (EBIT) should cover net interest by at least three times. For GC, the ratio of 5.15x suggests that interest is appropriately covered, which means that lenders may be inclined to lend more money to the company, as it is seen as safe in terms of payback.
Next Steps:
Although GC’s debt level is towards the higher end of the spectrum, its cash flow coverage seems adequate to meet obligations which means its debt is being efficiently utilised. Since there is also no concerns around GC's liquidity needs, this may be its optimal capital structure for the time being. Keep in mind I haven't considered other factors such as how GC has been performing in the past. I suggest you continue to research Great Canadian Gaming to get a more holistic view of the small-cap by looking at:
Valuation: What is GC worth today? Is the stock undervalued, even when its growth outlook is factored into its intrinsic value? The intrinsic value infographic in our free research report helps visualize whether GC is currently mispriced by the market.
Historical Performance: What has GC's returns been like over the past? Go into more detail in the past track record analysis and take a look at the free visual representations of our analysis for more clarity.
Other High-Performing Stocks: Are there other stocks that provide better prospects with proven track records? Explore our free list of these great stocks here.
We aim to bring you long-term focused research analysis driven by fundamental data. Note that our analysis may not factor in the latest price-sensitive company announcements or qualitative material.
If you spot an error that warrants correction, please contact the editor at editorial-team@simplywallst.com. This article by Simply Wall St is general in nature. It does not constitute a recommendation to buy or sell any stock, and does not take account of your objectives, or your financial situation. Simply Wall St has no position in the stocks mentioned. Thank you for reading.
