
 Yahoo Finance
 You Might Like Ferroglobe PLC (NASDAQ:GSM) But Do You Like Its Debt?

Want to participate in a short research study? Help shape the future of investing tools and you could win a $250 gift card!
Ferroglobe PLC (NASDAQ:GSM) is a small-cap stock with a market capitalization of US$277m. While investors primarily focus on the growth potential and competitive landscape of the small-cap companies, they end up ignoring a key aspect, which could be the biggest threat to its existence: its financial health. Why is it important? Given that GSM is not presently profitable, it’s vital to understand the current state of its operations and pathway to profitability. Let's work through some financial health checks you may wish to consider if you're interested in this stock. However, this is just a partial view of the stock, and I suggest you dig deeper yourself into GSM here.
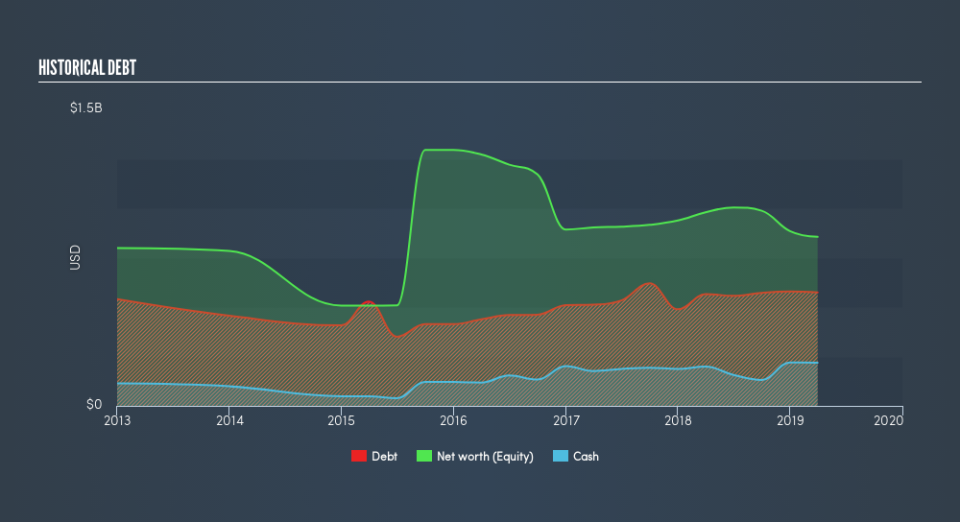
GSM’s Debt (And Cash Flows)
Over the past year, GSM has maintained its debt levels at around US$662m – this includes long-term debt. At this constant level of debt, GSM currently has US$219m remaining in cash and short-term investments to keep the business going. Additionally, GSM has produced cash from operations of US$103m during the same period of time, resulting in an operating cash to total debt ratio of 16%, signalling that GSM’s operating cash is less than its debt.
Can GSM meet its short-term obligations with the cash in hand?
Looking at GSM’s US$486m in current liabilities, it seems that the business has maintained a safe level of current assets to meet its obligations, with the current ratio last standing at 1.74x. The current ratio is calculated by dividing current assets by current liabilities. For Metals and Mining companies, this ratio is within a sensible range since there is a bit of a cash buffer without leaving too much capital in a low-return environment.
Does GSM face the risk of succumbing to its debt-load?
With a debt-to-equity ratio of 67%, GSM can be considered as an above-average leveraged company. This is a bit unusual for a small-cap stock, since they generally have a harder time borrowing than large more established companies. Though, since GSM is presently unprofitable, sustainability of its current state of operations becomes a concern. Maintaining a high level of debt, while revenues are still below costs, can be dangerous as liquidity tends to dry up in unexpected downturns.
Next Steps:
GSM’s high cash coverage means that, although its debt levels are high, the company is able to utilise its borrowings efficiently in order to generate cash flow. This may mean this is an optimal capital structure for the business, given that it is also meeting its short-term commitment. Keep in mind I haven't considered other factors such as how GSM has been performing in the past. You should continue to research Ferroglobe to get a more holistic view of the small-cap by looking at:
Future Outlook: What are well-informed industry analysts predicting for GSM’s future growth? Take a look at our free research report of analyst consensus for GSM’s outlook.
Valuation: What is GSM worth today? Is the stock undervalued, even when its growth outlook is factored into its intrinsic value? The intrinsic value infographic in our free research report helps visualize whether GSM is currently mispriced by the market.
Other High-Performing Stocks: Are there other stocks that provide better prospects with proven track records? Explore our free list of these great stocks here.
We aim to bring you long-term focused research analysis driven by fundamental data. Note that our analysis may not factor in the latest price-sensitive company announcements or qualitative material.
If you spot an error that warrants correction, please contact the editor at editorial-team@simplywallst.com. This article by Simply Wall St is general in nature. It does not constitute a recommendation to buy or sell any stock, and does not take account of your objectives, or your financial situation. Simply Wall St has no position in the stocks mentioned. Thank you for reading.