
 Yahoo Finance
 You Might Like CNX Resources Corporation (NYSE:CNX) But Do You Like Its Debt?
While small-cap stocks, such as CNX Resources Corporation (NYSE:CNX) with its market cap of US$2.1b, are popular for their explosive growth, investors should also be aware of their balance sheet to judge whether the company can survive a downturn. Assessing first and foremost the financial health is vital, as mismanagement of capital can lead to bankruptcies, which occur at a higher rate for small-caps. The following basic checks can help you get a picture of the company's balance sheet strength. Nevertheless, this is just a partial view of the stock, and I’d encourage you to dig deeper yourself into CNX here.
CNX’s Debt (And Cash Flows)
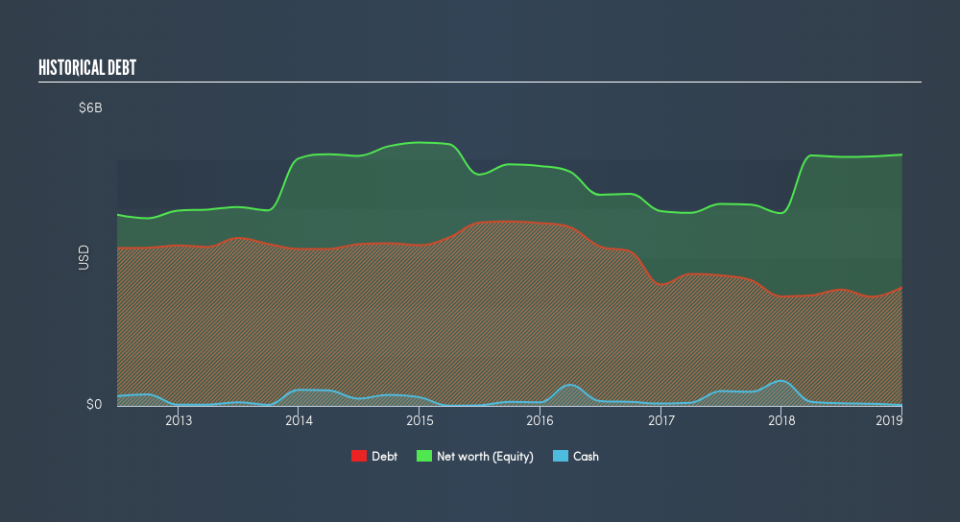
CNX's debt levels surged from US$2.2b to US$2.4b over the last 12 months – this includes long-term debt. With this increase in debt, the current cash and short-term investment levels stands at US$17m to keep the business going. On top of this, CNX has produced cash from operations of US$886m over the same time period, resulting in an operating cash to total debt ratio of 37%, meaning that CNX’s debt is appropriately covered by operating cash.
Can CNX meet its short-term obligations with the cash in hand?
With current liabilities at US$523m, it appears that the company arguably has a rather low level of current assets relative its obligations, with the current ratio last standing at 0.96x. The current ratio is calculated by dividing current assets by current liabilities.
Is CNX’s debt level acceptable?
With debt reaching 47% of equity, CNX may be thought of as relatively highly levered. This is somewhat unusual for small-caps companies, since lenders are often hesitant to provide attractive interest rates to less-established businesses. We can check to see whether CNX is able to meet its debt obligations by looking at the net interest coverage ratio. A company generating earnings before interest and tax (EBIT) at least three times its net interest payments is considered financially sound. In CNX's, case, the ratio of 3.55x suggests that interest is appropriately covered, which means that lenders may be inclined to lend more money to the company, as it is seen as safe in terms of payback.
Next Steps:
Although CNX’s debt level is towards the higher end of the spectrum, its cash flow coverage seems adequate to meet debt obligations which means its debt is being efficiently utilised. But, its low liquidity raises concerns over whether current asset management practices are properly implemented for the small-cap. Keep in mind I haven't considered other factors such as how CNX has been performing in the past. You should continue to research CNX Resources to get a more holistic view of the stock by looking at:
Future Outlook: What are well-informed industry analysts predicting for CNX’s future growth? Take a look at our free research report of analyst consensus for CNX’s outlook.
Historical Performance: What has CNX's returns been like over the past? Go into more detail in the past track record analysis and take a look at the free visual representations of our analysis for more clarity.
Other High-Performing Stocks: Are there other stocks that provide better prospects with proven track records? Explore our free list of these great stocks here.
We aim to bring you long-term focused research analysis driven by fundamental data. Note that our analysis may not factor in the latest price-sensitive company announcements or qualitative material.
If you spot an error that warrants correction, please contact the editor at editorial-team@simplywallst.com. This article by Simply Wall St is general in nature. It does not constitute a recommendation to buy or sell any stock, and does not take account of your objectives, or your financial situation. Simply Wall St has no position in the stocks mentioned. Thank you for reading.
