
 Yahoo Finance
 Is Metro Inc. (TSE:MRU) A Smart Choice For Dividend Investors?

Want to participate in a short research study? Help shape the future of investing tools and you could win a $250 gift card!
Could Metro Inc. (TSE:MRU) be an attractive dividend share to own for the long haul? Investors are often drawn to strong companies with the idea of reinvesting the dividends. Unfortunately, it's common for investors to be enticed in by the seemingly attractive yield, and lose money when the company has to cut its dividend payments.
A slim 1.6% yield is hard to get excited about, but the long payment history is respectable. At the right price, or with strong growth opportunities, Metro could have potential. Before you buy any stock for its dividend however, you should always remember Warren Buffett's two rules: 1) Don't lose money, and 2) Remember rule #1. We'll run through some checks below to help with this.
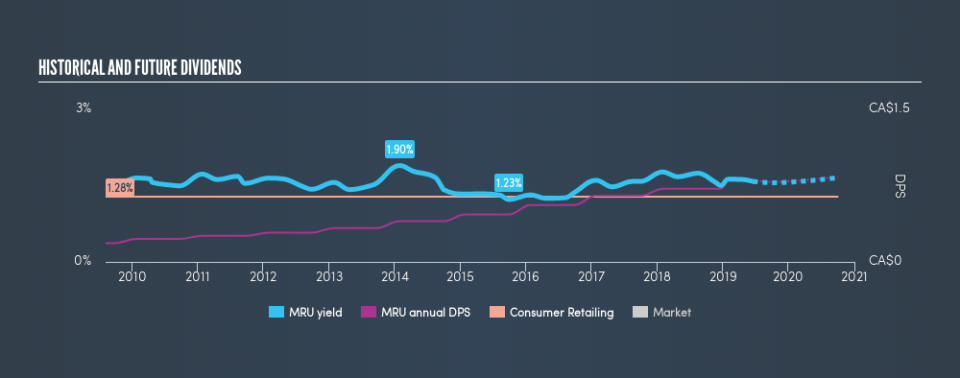
Explore this interactive chart for our latest analysis on Metro!
Payout ratios
Companies (usually) pay dividends out of their earnings. If a company is paying more than it earns, the dividend might have to be cut. As a result, we should always investigate whether a company can afford its dividend, measured as a percentage of a company's net income after tax. In the last year, Metro paid out 30% of its profit as dividends. This is a middling range that strikes a nice balance between paying dividends to shareholders, and retaining enough earnings to invest in future growth. Besides, if reinvestment opportunities dry up, the company has room to increase the dividend.
We also measure dividends paid against a company's levered free cash flow, to see if enough cash was generated to cover the dividend. Metro paid out 62% of its cash flow as dividends last year, which is within a reasonable range for the average corporation. It's positive to see that Metro's dividend is covered by both profits and cash flow, since this is generally a sign that the dividend is sustainable, and a lower payout ratio usually suggests a greater margin of safety before the dividend gets cut.
Is Metro's Balance Sheet Risky?
As Metro has a meaningful amount of debt, we need to check its balance sheet to see if the company might have debt risks. A quick way to check a company's financial situation uses these two ratios: net debt divided by EBITDA (earnings before interest, tax, depreciation and amortisation), and net interest cover. Net debt to EBITDA measures a company's total debt load relative to its earnings (lower = less debt), while net interest cover measures the company's ability to pay the interest on its debt (higher = greater ability to pay interest costs). With net debt of more than twice its EBITDA, Metro has a noticeable amount of debt, although if business stays steady, this may not be overly concerning.
Net interest cover can be calculated by dividing earnings before interest and tax (EBIT) by the company's net interest expense. Net interest cover of 9.95 times its interest expense appears reasonable for Metro, although we're conscious that even high interest cover doesn't make a company bulletproof.
We update our data on Metro every 24 hours, so you can always get our latest analysis of its financial health, here.
Dividend Volatility
Before buying a stock for its income, we want to see if the dividends have been stable in the past, and if the company has a track record of maintaining its dividend. Metro has been paying dividends for a long time, but for the purpose of this analysis, we only examine the past 10 years of payments. The dividend has been stable over the past 10 years, which is great. We think this could suggest some resilience to the business and its dividends. During the past ten-year period, the first annual payment was CA$0.18 in 2009, compared to CA$0.80 last year. This works out to be a compound annual growth rate (CAGR) of approximately 16% a year over that time.
Dividends have been growing pretty quickly, and even more impressively, they haven't experienced any notable falls during this period.
Dividend Growth Potential
Dividend payments have been consistent over the past few years, but we should always check if earnings per share (EPS) are growing, as this will help maintain the purchasing power of the dividend. Metro's earnings per share have been essentially flat over the past five years. Flat earnings per share are acceptable for a time, but over the long term, the purchasing power of the company's dividends could be eroded by inflation. A payout ratio below 50% leaves ample room to reinvest in the business, and provides finanical flexibility. Earnings per share growth have grown slowly, which is not great, but if the retained earnings can be reinvested effectively, future growth may be stronger.
Conclusion
When we look at a dividend stock, we need to form a judgement on whether the dividend will grow, if the company is able to maintain it in a wide range of economic circumstances, and if the dividend payout is sustainable. Above all, we're glad to see that Metro pays out a low fraction of its earnings and, while it paid a higher percentage of cashflow, this also was within a normal range. Second, earnings growth has been mediocre, but at least the dividends have been relatively stable. Metro has a number of positive attributes, but it falls slightly short of our (admittedly high) standards. Were there evidence of a strong moat or an attractive valuation, it could still be well worth a look.
Earnings growth generally bodes well for the future value of company dividend payments. See if the 10 Metro analysts we track are forecasting continued growth with our free report on analyst estimates for the company.
Looking for more high-yielding dividend ideas? Try our curated list of dividend stocks with a yield above 3%.
We aim to bring you long-term focused research analysis driven by fundamental data. Note that our analysis may not factor in the latest price-sensitive company announcements or qualitative material.
If you spot an error that warrants correction, please contact the editor at editorial-team@simplywallst.com. This article by Simply Wall St is general in nature. It does not constitute a recommendation to buy or sell any stock, and does not take account of your objectives, or your financial situation. Simply Wall St has no position in the stocks mentioned. Thank you for reading.
