
 Yahoo Finance
 What Is Metalore Resources's (CVE:MET) P/E Ratio After Its Share Price Tanked?

To the annoyance of some shareholders, Metalore Resources (CVE:MET) shares are down a considerable 38% in the last month. The recent drop has obliterated the annual return, with the share price now down 10% over that longer period.
All else being equal, a share price drop should make a stock more attractive to potential investors. In the long term, share prices tend to follow earnings per share, but in the short term prices bounce around in response to short term factors (which are not always obvious). The implication here is that long term investors have an opportunity when expectations of a company are too low. Perhaps the simplest way to get a read on investors' expectations of a business is to look at its Price to Earnings Ratio (PE Ratio). Investors have optimistic expectations of companies with higher P/E ratios, compared to companies with lower P/E ratios.
See our latest analysis for Metalore Resources
How Does Metalore Resources's P/E Ratio Compare To Its Peers?
Metalore Resources's P/E of 12.74 indicates some degree of optimism towards the stock. You can see in the image below that the average P/E (8.2) for companies in the oil and gas industry is lower than Metalore Resources's P/E.
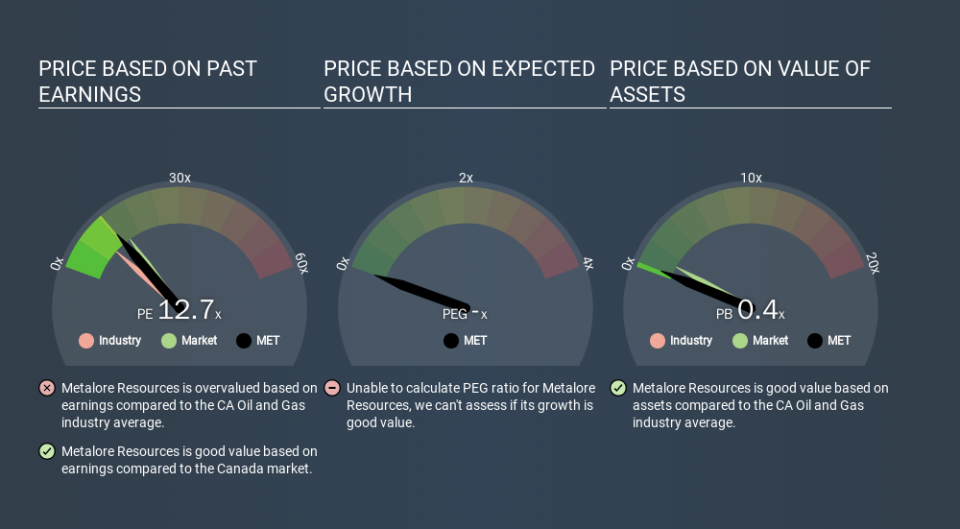
That means that the market expects Metalore Resources will outperform other companies in its industry. Clearly the market expects growth, but it isn't guaranteed. So investors should always consider the P/E ratio alongside other factors, such as whether company directors have been buying shares.
How Growth Rates Impact P/E Ratios
Generally speaking the rate of earnings growth has a profound impact on a company's P/E multiple. If earnings are growing quickly, then the 'E' in the equation will increase faster than it would otherwise. That means unless the share price increases, the P/E will reduce in a few years. And as that P/E ratio drops, the company will look cheap, unless its share price increases.
Metalore Resources saw earnings per share decrease by 37% last year. But EPS is up 205% over the last 3 years. And it has shrunk its earnings per share by 16% per year over the last five years. This might lead to muted expectations.
Remember: P/E Ratios Don't Consider The Balance Sheet
The 'Price' in P/E reflects the market capitalization of the company. So it won't reflect the advantage of cash, or disadvantage of debt. Theoretically, a business can improve its earnings (and produce a lower P/E in the future) by investing in growth. That means taking on debt (or spending its cash).
Such expenditure might be good or bad, in the long term, but the point here is that the balance sheet is not reflected by this ratio.
So What Does Metalore Resources's Balance Sheet Tell Us?
Metalore Resources has net cash of CA$652k. This is fairly high at 24% of its market capitalization. That might mean balance sheet strength is important to the business, but should also help push the P/E a bit higher than it would otherwise be.
The Bottom Line On Metalore Resources's P/E Ratio
Metalore Resources's P/E is 12.7 which is about average (13.6) in the CA market. While the lack of recent growth is probably muting optimism, the healthy balance sheet means the company retains potential for future growth. So it's not surprising to see it trade on a P/E roughly in line with the market. What can be absolutely certain is that the market has become significantly less optimistic about Metalore Resources over the last month, with the P/E ratio falling from 20.4 back then to 12.7 today. For those who don't like to trade against momentum, that could be a warning sign, but a contrarian investor might want to take a closer look.
Investors should be looking to buy stocks that the market is wrong about. If it is underestimating a company, investors can make money by buying and holding the shares until the market corrects itself. We don't have analyst forecasts, but you could get a better understanding of its growth by checking out this more detailed historical graph of earnings, revenue and cash flow.
But note: Metalore Resources may not be the best stock to buy. So take a peek at this free list of interesting companies with strong recent earnings growth (and a P/E ratio below 20).
If you spot an error that warrants correction, please contact the editor at editorial-team@simplywallst.com. This article by Simply Wall St is general in nature. It does not constitute a recommendation to buy or sell any stock, and does not take account of your objectives, or your financial situation. Simply Wall St has no position in the stocks mentioned.
We aim to bring you long-term focused research analysis driven by fundamental data. Note that our analysis may not factor in the latest price-sensitive company announcements or qualitative material. Thank you for reading.
