
 Yahoo Finance
 Merck KGaA's (ETR:MRK) investors will be pleased with their favorable 74% return over the last five years
Stock pickers are generally looking for stocks that will outperform the broader market. And the truth is, you can make significant gains if you buy good quality businesses at the right price. For example, long term Merck KGaA (ETR:MRK) shareholders have enjoyed a 64% share price rise over the last half decade, well in excess of the market decline of around 0.7% (not including dividends).
Now it's worth having a look at the company's fundamentals too, because that will help us determine if the long term shareholder return has matched the performance of the underlying business.
Check out our latest analysis for Merck KGaA
While markets are a powerful pricing mechanism, share prices reflect investor sentiment, not just underlying business performance. By comparing earnings per share (EPS) and share price changes over time, we can get a feel for how investor attitudes to a company have morphed over time.
During five years of share price growth, Merck KGaA achieved compound earnings per share (EPS) growth of 21% per year. The EPS growth is more impressive than the yearly share price gain of 10% over the same period. So one could conclude that the broader market has become more cautious towards the stock.
The graphic below depicts how EPS has changed over time (unveil the exact values by clicking on the image).
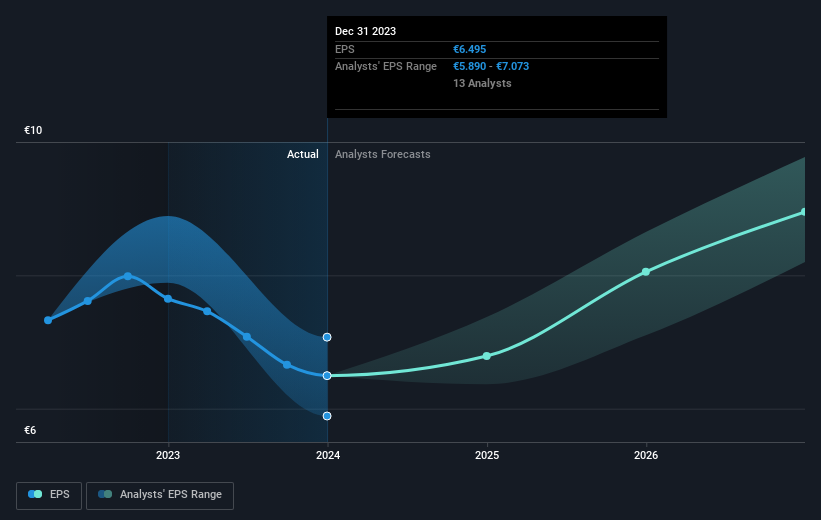
Before buying or selling a stock, we always recommend a close examination of historic growth trends, available here.
What About Dividends?
As well as measuring the share price return, investors should also consider the total shareholder return (TSR). The TSR incorporates the value of any spin-offs or discounted capital raisings, along with any dividends, based on the assumption that the dividends are reinvested. Arguably, the TSR gives a more comprehensive picture of the return generated by a stock. In the case of Merck KGaA, it has a TSR of 74% for the last 5 years. That exceeds its share price return that we previously mentioned. The dividends paid by the company have thusly boosted the total shareholder return.
A Different Perspective
Merck KGaA shareholders are down 5.6% for the year (even including dividends), but the market itself is up 4.9%. However, keep in mind that even the best stocks will sometimes underperform the market over a twelve month period. Longer term investors wouldn't be so upset, since they would have made 12%, each year, over five years. If the fundamental data continues to indicate long term sustainable growth, the current sell-off could be an opportunity worth considering. Before forming an opinion on Merck KGaA you might want to consider these 3 valuation metrics.
Of course, you might find a fantastic investment by looking elsewhere. So take a peek at this free list of companies we expect will grow earnings.
Please note, the market returns quoted in this article reflect the market weighted average returns of stocks that currently trade on German exchanges.
Have feedback on this article? Concerned about the content? Get in touch with us directly. Alternatively, email editorial-team (at) simplywallst.com.
This article by Simply Wall St is general in nature. We provide commentary based on historical data and analyst forecasts only using an unbiased methodology and our articles are not intended to be financial advice. It does not constitute a recommendation to buy or sell any stock, and does not take account of your objectives, or your financial situation. We aim to bring you long-term focused analysis driven by fundamental data. Note that our analysis may not factor in the latest price-sensitive company announcements or qualitative material. Simply Wall St has no position in any stocks mentioned.
