
 Yahoo Finance
 MEG Energy (TSE:MEG) Might Have The Makings Of A Multi-Bagger
To find a multi-bagger stock, what are the underlying trends we should look for in a business? One common approach is to try and find a company with returns on capital employed (ROCE) that are increasing, in conjunction with a growing amount of capital employed. This shows us that it's a compounding machine, able to continually reinvest its earnings back into the business and generate higher returns. So on that note, MEG Energy (TSE:MEG) looks quite promising in regards to its trends of return on capital.
Understanding Return On Capital Employed (ROCE)
For those who don't know, ROCE is a measure of a company's yearly pre-tax profit (its return), relative to the capital employed in the business. Analysts use this formula to calculate it for MEG Energy:
Return on Capital Employed = Earnings Before Interest and Tax (EBIT) ÷ (Total Assets - Current Liabilities)
0.19 = CA$1.2b ÷ (CA$6.9b - CA$645m) (Based on the trailing twelve months to March 2023).
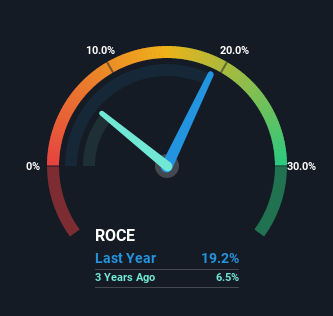
So, MEG Energy has an ROCE of 19%. That's a pretty standard return and it's in line with the industry average of 19%.
See our latest analysis for MEG Energy
Above you can see how the current ROCE for MEG Energy compares to its prior returns on capital, but there's only so much you can tell from the past. If you'd like to see what analysts are forecasting going forward, you should check out our free report for MEG Energy.
So How Is MEG Energy's ROCE Trending?
We're pretty happy with how the ROCE has been trending at MEG Energy. The data shows that returns on capital have increased by 3,083% over the trailing five years. That's a very favorable trend because this means that the company is earning more per dollar of capital that's being employed. In regards to capital employed, MEG Energy appears to been achieving more with less, since the business is using 21% less capital to run its operation. If this trend continues, the business might be getting more efficient but it's shrinking in terms of total assets.
Our Take On MEG Energy's ROCE
From what we've seen above, MEG Energy has managed to increase it's returns on capital all the while reducing it's capital base. And a remarkable 131% total return over the last five years tells us that investors are expecting more good things to come in the future. In light of that, we think it's worth looking further into this stock because if MEG Energy can keep these trends up, it could have a bright future ahead.
While MEG Energy looks impressive, no company is worth an infinite price. The intrinsic value infographic in our free research report helps visualize whether MEG is currently trading for a fair price.
For those who like to invest in solid companies, check out this free list of companies with solid balance sheets and high returns on equity.
Have feedback on this article? Concerned about the content? Get in touch with us directly. Alternatively, email editorial-team (at) simplywallst.com.
This article by Simply Wall St is general in nature. We provide commentary based on historical data and analyst forecasts only using an unbiased methodology and our articles are not intended to be financial advice. It does not constitute a recommendation to buy or sell any stock, and does not take account of your objectives, or your financial situation. We aim to bring you long-term focused analysis driven by fundamental data. Note that our analysis may not factor in the latest price-sensitive company announcements or qualitative material. Simply Wall St has no position in any stocks mentioned.
Join A Paid User Research Session
You’ll receive a US$30 Amazon Gift card for 1 hour of your time while helping us build better investing tools for the individual investors like yourself. Sign up here
