
 Yahoo Finance
 Is MedMira Inc.'s (CVE:MIR) CEO Pay Justified?

Hermes Chan became the CEO of MedMira Inc. (CVE:MIR) in 2006. This analysis aims first to contrast CEO compensation with other companies that have similar market capitalization. Then we'll look at a snap shot of the business growth. Third, we'll reflect on the total return to shareholders over three years, as a second measure of business performance. The aim of all this is to consider the appropriateness of CEO pay levels.
Check out our latest analysis for MedMira
How Does Hermes Chan's Compensation Compare With Similar Sized Companies?
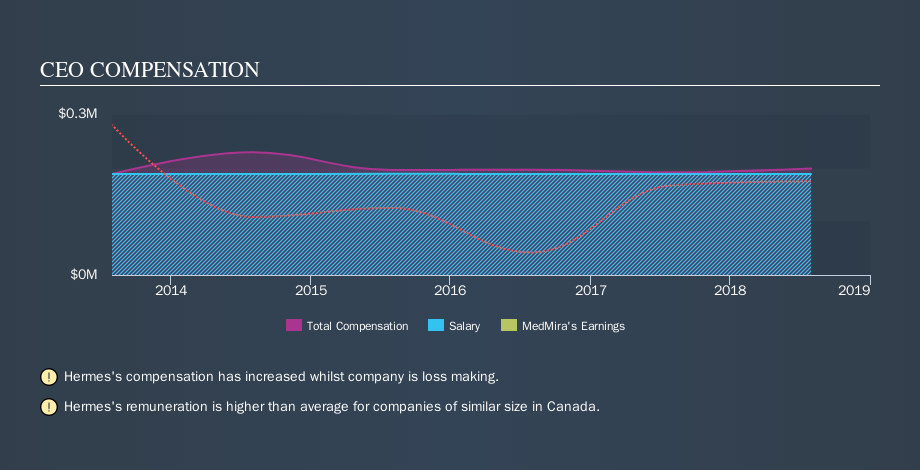
At the time of writing our data says that MedMira Inc. has a market cap of CA$6.6m, and is paying total annual CEO compensation of CA$198k. (This figure is for the year to July 2018). While we always look at total compensation first, we note that the salary component is less, at CA$188k. We examined a group of similar sized companies, with market capitalizations of below CA$263m. The median CEO total compensation in that group is CA$144k.
Thus we can conclude that Hermes Chan receives more in total compensation than the median of a group of companies in the same market, and of similar size to MedMira Inc.. However, this doesn't necessarily mean the pay is too high. We can better assess whether the pay is overly generous by looking into the underlying business performance.
You can see, below, how CEO compensation at MedMira has changed over time.
Is MedMira Inc. Growing?
On average over the last three years, MedMira Inc. has grown earnings per share (EPS) by 30% each year (using a line of best fit). In the last year, its revenue is up 11%.
This shows that the company has improved itself over the last few years. Good news for shareholders. It's a real positive to see this sort of growth in a single year. That suggests a healthy and growing business. We don't have analyst forecasts, but you could get a better understanding of its growth by checking out this more detailed historical graph of earnings, revenue and cash flow.
Has MedMira Inc. Been A Good Investment?
Since shareholders would have lost about 75% over three years, some MedMira Inc. shareholders would surely be feeling negative emotions. This suggests it would be unwise for the company to pay the CEO too generously.
In Summary...
We compared total CEO remuneration at MedMira Inc. with the amount paid at companies with a similar market capitalization. As discussed above, we discovered that the company pays more than the median of that group.
Importantly, though, the company has impressed with its earnings per share growth, over three years. On the other hand returns to investors over the same period have probably disappointed many. One might thus conclude that it would be better if the company waited until growth is reflected in the share price, before increasing CEO compensation. Shareholders may want to check for free if MedMira insiders are buying or selling shares.
If you want to buy a stock that is better than MedMira, this free list of high return, low debt companies is a great place to look.
We aim to bring you long-term focused research analysis driven by fundamental data. Note that our analysis may not factor in the latest price-sensitive company announcements or qualitative material.
If you spot an error that warrants correction, please contact the editor at editorial-team@simplywallst.com. This article by Simply Wall St is general in nature. It does not constitute a recommendation to buy or sell any stock, and does not take account of your objectives, or your financial situation. Simply Wall St has no position in the stocks mentioned. Thank you for reading.
