
 Yahoo Finance
 Maxim Power (TSE:MXG) Is Experiencing Growth In Returns On Capital
If we want to find a stock that could multiply over the long term, what are the underlying trends we should look for? One common approach is to try and find a company with returns on capital employed (ROCE) that are increasing, in conjunction with a growing amount of capital employed. If you see this, it typically means it's a company with a great business model and plenty of profitable reinvestment opportunities. So on that note, Maxim Power (TSE:MXG) looks quite promising in regards to its trends of return on capital.
Understanding Return On Capital Employed (ROCE)
For those that aren't sure what ROCE is, it measures the amount of pre-tax profits a company can generate from the capital employed in its business. The formula for this calculation on Maxim Power is:
Return on Capital Employed = Earnings Before Interest and Tax (EBIT) ÷ (Total Assets - Current Liabilities)
0.031 = CA$12m ÷ (CA$390m - CA$18m) (Based on the trailing twelve months to September 2022).
Thus, Maxim Power has an ROCE of 3.1%. In absolute terms, that's a low return and it also under-performs the Renewable Energy industry average of 4.7%.
See our latest analysis for Maxim Power
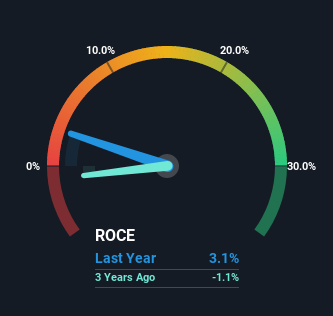
Historical performance is a great place to start when researching a stock so above you can see the gauge for Maxim Power's ROCE against it's prior returns. If you want to delve into the historical earnings, revenue and cash flow of Maxim Power, check out these free graphs here.
What The Trend Of ROCE Can Tell Us
We're delighted to see that Maxim Power is reaping rewards from its investments and is now generating some pre-tax profits. About five years ago the company was generating losses but things have turned around because it's now earning 3.1% on its capital. In addition to that, Maxim Power is employing 112% more capital than previously which is expected of a company that's trying to break into profitability. We like this trend, because it tells us the company has profitable reinvestment opportunities available to it, and if it continues going forward that can lead to a multi-bagger performance.
What We Can Learn From Maxim Power's ROCE
Long story short, we're delighted to see that Maxim Power's reinvestment activities have paid off and the company is now profitable. Considering the stock has delivered 26% to its stockholders over the last five years, it may be fair to think that investors aren't fully aware of the promising trends yet. So exploring more about this stock could uncover a good opportunity, if the valuation and other metrics stack up.
On a final note, we've found 2 warning signs for Maxim Power that we think you should be aware of.
While Maxim Power may not currently earn the highest returns, we've compiled a list of companies that currently earn more than 25% return on equity. Check out this free list here.
Have feedback on this article? Concerned about the content? Get in touch with us directly. Alternatively, email editorial-team (at) simplywallst.com.
This article by Simply Wall St is general in nature. We provide commentary based on historical data and analyst forecasts only using an unbiased methodology and our articles are not intended to be financial advice. It does not constitute a recommendation to buy or sell any stock, and does not take account of your objectives, or your financial situation. We aim to bring you long-term focused analysis driven by fundamental data. Note that our analysis may not factor in the latest price-sensitive company announcements or qualitative material. Simply Wall St has no position in any stocks mentioned.
Join A Paid User Research Session
You’ll receive a US$30 Amazon Gift card for 1 hour of your time while helping us build better investing tools for the individual investors like yourself. Sign up here
