
 Yahoo Finance
 Are Maverix Metals Inc’s (CVE:MMX) Interest Costs Too High?

Investors are always looking for growth in small-cap stocks like Maverix Metals Inc (CVE:MMX), with a market cap of CA$420.3m. However, an important fact which most ignore is: how financially healthy is the business? Evaluating financial health as part of your investment thesis is vital, as mismanagement of capital can lead to bankruptcies, which occur at a higher rate for small-caps. Here are few basic financial health checks you should consider before taking the plunge. Nevertheless, since I only look at basic financial figures, I recommend you dig deeper yourself into MMX here.
How much cash does MMX generate through its operations?
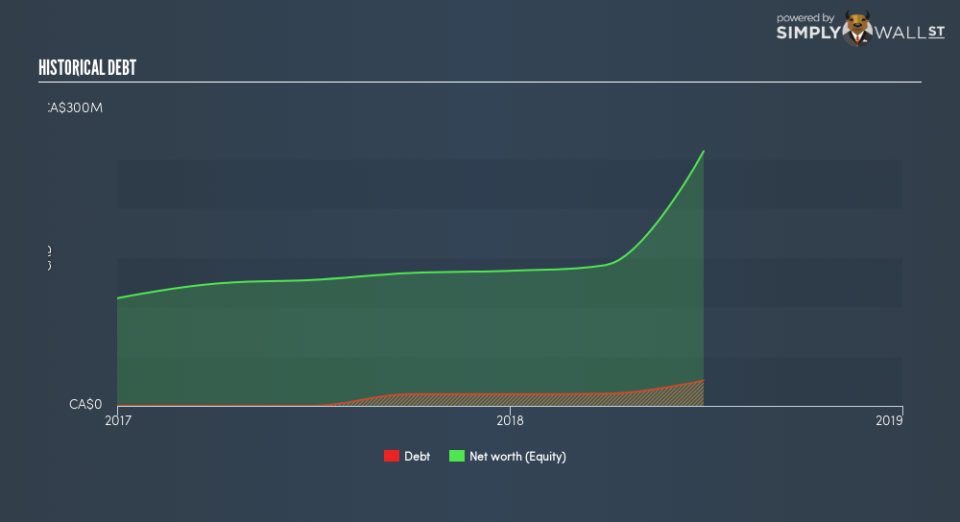
MMX has increased its debt level by about CA$25.9m over the last 12 months comprising of short- and long-term debt. With this ramp up in debt, the current cash and short-term investment levels stands at CA$8.7m , ready to deploy into the business. Additionally, MMX has produced cash from operations of CA$11.1m during the same period of time, resulting in an operating cash to total debt ratio of 43.0%, indicating that MMX’s operating cash is sufficient to cover its debt. This ratio can also be a sign of operational efficiency as an alternative to return on assets. In MMX’s case, it is able to generate 0.43x cash from its debt capital.
Does MMX’s liquid assets cover its short-term commitments?
Looking at MMX’s most recent CA$3.7m liabilities, it appears that the company has been able to meet these commitments with a current assets level of CA$41.0m, leading to a 11.01x current account ratio. Though, a ratio greater than 3x may be considered as too high, as MMX could be holding too much capital in a low-return investment environment.
Can MMX service its debt comfortably?
MMX’s level of debt is appropriate relative to its total equity, at 10.0%. This range is considered safe as MMX is not taking on too much debt obligation, which can be restrictive and risky for equity-holders. We can test if MMX’s debt levels are sustainable by measuring interest payments against earnings of a company. Ideally, earnings before interest and tax (EBIT) should cover net interest by at least three times. For MMX, the ratio of 5.49x suggests that interest is appropriately covered, which means that debtors may be willing to loan the company more money, giving MMX ample headroom to grow its debt facilities.
Next Steps:
MMX has demonstrated its ability to generate sufficient levels of cash flow, while its debt hovers at a safe level. In addition to this, the company will be able to pay all of its upcoming liabilities from its current short-term assets. This is only a rough assessment of financial health, and I’m sure MMX has company-specific issues impacting its capital structure decisions. I suggest you continue to research Maverix Metals to get a more holistic view of the stock by looking at:
Valuation: What is MMX worth today? Is the stock undervalued, even when its growth outlook is factored into its intrinsic value? The intrinsic value infographic in our free research report helps visualize whether MMX is currently mispriced by the market.
Historical Performance: What has MMX’s returns been like over the past? Go into more detail in the past track record analysis and take a look at the free visual representations of our analysis for more clarity.
Other High-Performing Stocks: Are there other stocks that provide better prospects with proven track records? Explore our free list of these great stocks here.
To help readers see past the short term volatility of the financial market, we aim to bring you a long-term focused research analysis purely driven by fundamental data. Note that our analysis does not factor in the latest price-sensitive company announcements.
The author is an independent contributor and at the time of publication had no position in the stocks mentioned. For errors that warrant correction please contact the editor at editorial-team@simplywallst.com.
