
 Yahoo Finance
 Mattel (NASDAQ:MAT) shareholders are still up 51% over 5 years despite pulling back 4.0% in the past week
Mattel, Inc. (NASDAQ:MAT) shareholders might be concerned after seeing the share price drop 11% in the last quarter. But at least the stock is up over the last five years. Unfortunately its return of 51% is below the market return of 95%.
Since the long term performance has been good but there's been a recent pullback of 4.0%, let's check if the fundamentals match the share price.
Check out our latest analysis for Mattel
While the efficient markets hypothesis continues to be taught by some, it has been proven that markets are over-reactive dynamic systems, and investors are not always rational. By comparing earnings per share (EPS) and share price changes over time, we can get a feel for how investor attitudes to a company have morphed over time.
During the five years of share price growth, Mattel moved from a loss to profitability. That's generally thought to be a genuine positive, so investors may expect to see an increasing share price. Since the company was unprofitable five years ago, but not three years ago, it's worth taking a look at the returns in the last three years, too. We can see that the Mattel share price is down 12% in the last three years. In the same period, EPS is up 11% per year. So there seems to be a mismatch between the positive EPS growth and the change in the share price, which is down -4% per year.
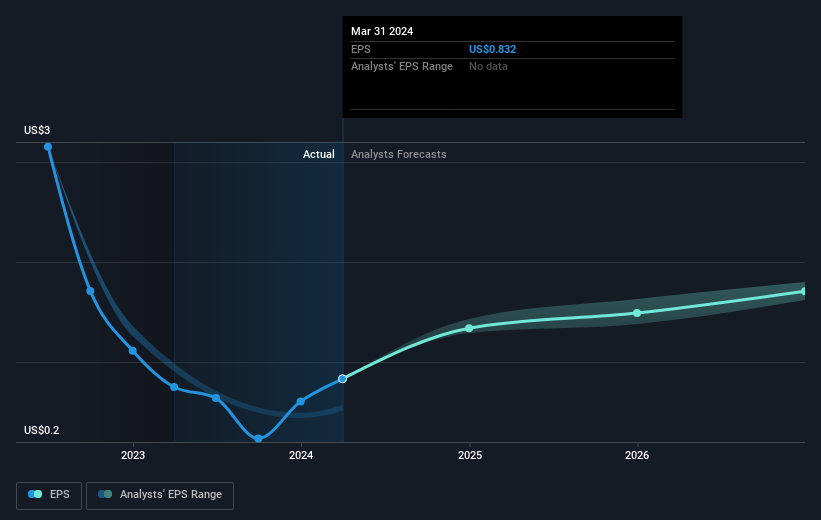
The company's earnings per share (over time) is depicted in the image below (click to see the exact numbers).
We know that Mattel has improved its bottom line lately, but is it going to grow revenue? This free report showing analyst revenue forecasts should help you figure out if the EPS growth can be sustained.
A Different Perspective
While the broader market gained around 23% in the last year, Mattel shareholders lost 7.1%. However, keep in mind that even the best stocks will sometimes underperform the market over a twelve month period. On the bright side, long term shareholders have made money, with a gain of 9% per year over half a decade. If the fundamental data continues to indicate long term sustainable growth, the current sell-off could be an opportunity worth considering. While it is well worth considering the different impacts that market conditions can have on the share price, there are other factors that are even more important. Case in point: We've spotted 2 warning signs for Mattel you should be aware of.
If you like to buy stocks alongside management, then you might just love this free list of companies. (Hint: many of them are unnoticed AND have attractive valuation).
Please note, the market returns quoted in this article reflect the market weighted average returns of stocks that currently trade on American exchanges.
Have feedback on this article? Concerned about the content? Get in touch with us directly. Alternatively, email editorial-team (at) simplywallst.com.
This article by Simply Wall St is general in nature. We provide commentary based on historical data and analyst forecasts only using an unbiased methodology and our articles are not intended to be financial advice. It does not constitute a recommendation to buy or sell any stock, and does not take account of your objectives, or your financial situation. We aim to bring you long-term focused analysis driven by fundamental data. Note that our analysis may not factor in the latest price-sensitive company announcements or qualitative material. Simply Wall St has no position in any stocks mentioned.
Have feedback on this article? Concerned about the content? Get in touch with us directly. Alternatively, email editorial-team@simplywallst.com
