
 Yahoo Finance
 Market Still Lacking Some Conviction On Imperial Metals Corporation (TSE:III)
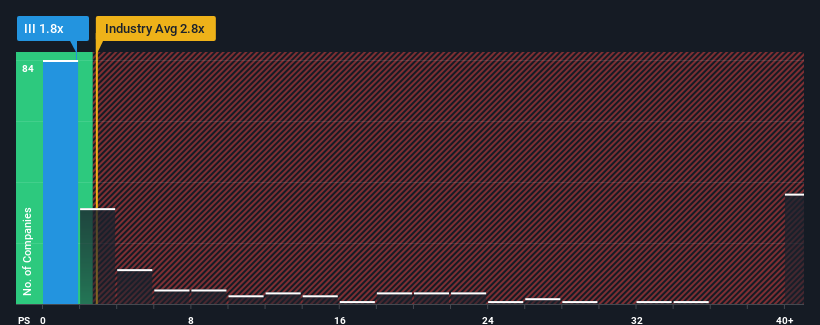
With a price-to-sales (or "P/S") ratio of 1.8x Imperial Metals Corporation (TSE:III) may be sending bullish signals at the moment, given that almost half of all the Metals and Mining companies in Canada have P/S ratios greater than 2.8x and even P/S higher than 22x are not unusual. Nonetheless, we'd need to dig a little deeper to determine if there is a rational basis for the reduced P/S.
Check out our latest analysis for Imperial Metals
How Imperial Metals Has Been Performing
Imperial Metals has been doing a good job lately as it's been growing revenue at a solid pace. It might be that many expect the respectable revenue performance to degrade substantially, which has repressed the P/S. Those who are bullish on Imperial Metals will be hoping that this isn't the case, so that they can pick up the stock at a lower valuation.
Although there are no analyst estimates available for Imperial Metals, take a look at this free data-rich visualisation to see how the company stacks up on earnings, revenue and cash flow.
Is There Any Revenue Growth Forecasted For Imperial Metals?
The only time you'd be truly comfortable seeing a P/S as low as Imperial Metals' is when the company's growth is on track to lag the industry.
Retrospectively, the last year delivered an exceptional 29% gain to the company's top line. Pleasingly, revenue has also lifted 141% in aggregate from three years ago, thanks to the last 12 months of growth. So we can start by confirming that the company has done a great job of growing revenue over that time.
Comparing that to the industry, which is only predicted to deliver 15% growth in the next 12 months, the company's momentum is stronger based on recent medium-term annualised revenue results.
With this information, we find it odd that Imperial Metals is trading at a P/S lower than the industry. Apparently some shareholders believe the recent performance has exceeded its limits and have been accepting significantly lower selling prices.
The Key Takeaway
Using the price-to-sales ratio alone to determine if you should sell your stock isn't sensible, however it can be a practical guide to the company's future prospects.
Our examination of Imperial Metals revealed its three-year revenue trends aren't boosting its P/S anywhere near as much as we would have predicted, given they look better than current industry expectations. Potential investors that are sceptical over continued revenue performance may be preventing the P/S ratio from matching previous strong performance. It appears many are indeed anticipating revenue instability, because the persistence of these recent medium-term conditions would normally provide a boost to the share price.
We don't want to rain on the parade too much, but we did also find 3 warning signs for Imperial Metals (2 shouldn't be ignored!) that you need to be mindful of.
It's important to make sure you look for a great company, not just the first idea you come across. So if growing profitability aligns with your idea of a great company, take a peek at this free list of interesting companies with strong recent earnings growth (and a low P/E).
Have feedback on this article? Concerned about the content? Get in touch with us directly. Alternatively, email editorial-team (at) simplywallst.com.
This article by Simply Wall St is general in nature. We provide commentary based on historical data and analyst forecasts only using an unbiased methodology and our articles are not intended to be financial advice. It does not constitute a recommendation to buy or sell any stock, and does not take account of your objectives, or your financial situation. We aim to bring you long-term focused analysis driven by fundamental data. Note that our analysis may not factor in the latest price-sensitive company announcements or qualitative material. Simply Wall St has no position in any stocks mentioned.
Join A Paid User Research Session
You’ll receive a US$30 Amazon Gift card for 1 hour of your time while helping us build better investing tools for the individual investors like yourself. Sign up here
