
 Yahoo Finance
 Is The Market Rewarding Spire Healthcare Group plc (LON:SPI) With A Negative Sentiment As A Result Of Its Mixed Fundamentals?
It is hard to get excited after looking at Spire Healthcare Group's (LON:SPI) recent performance, when its stock has declined 8.1% over the past month. We, however decided to study the company's financials to determine if they have got anything to do with the price decline. Long-term fundamentals are usually what drive market outcomes, so it's worth paying close attention. Specifically, we decided to study Spire Healthcare Group's ROE in this article.
Return on equity or ROE is an important factor to be considered by a shareholder because it tells them how effectively their capital is being reinvested. In simpler terms, it measures the profitability of a company in relation to shareholder's equity.
See our latest analysis for Spire Healthcare Group
How Is ROE Calculated?
ROE can be calculated by using the formula:
Return on Equity = Net Profit (from continuing operations) ÷ Shareholders' Equity
So, based on the above formula, the ROE for Spire Healthcare Group is:
1.1% = UK£8.2m ÷ UK£725m (Based on the trailing twelve months to December 2022).
The 'return' refers to a company's earnings over the last year. One way to conceptualize this is that for each £1 of shareholders' capital it has, the company made £0.01 in profit.
What Has ROE Got To Do With Earnings Growth?
We have already established that ROE serves as an efficient profit-generating gauge for a company's future earnings. Depending on how much of these profits the company reinvests or "retains", and how effectively it does so, we are then able to assess a company’s earnings growth potential. Assuming all else is equal, companies that have both a higher return on equity and higher profit retention are usually the ones that have a higher growth rate when compared to companies that don't have the same features.
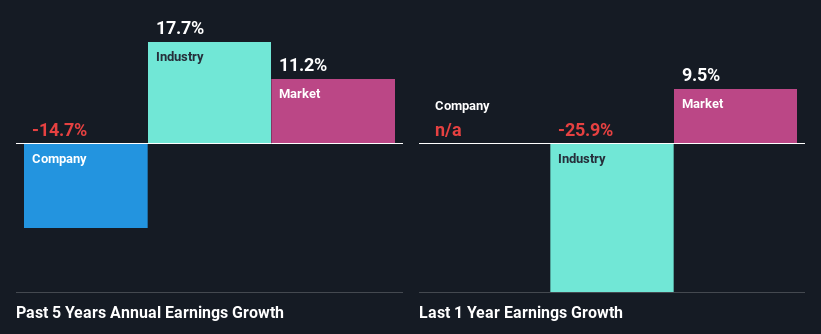
A Side By Side comparison of Spire Healthcare Group's Earnings Growth And 1.1% ROE
As you can see, Spire Healthcare Group's ROE looks pretty weak. Not just that, even compared to the industry average of 12%, the company's ROE is entirely unremarkable. Therefore, it might not be wrong to say that the five year net income decline of 15% seen by Spire Healthcare Group was possibly a result of it having a lower ROE. However, there could also be other factors causing the earnings to decline. Such as - low earnings retention or poor allocation of capital.
That being said, we compared Spire Healthcare Group's performance with the industry and were concerned when we found that while the company has shrunk its earnings, the industry has grown its earnings at a rate of 18% in the same 5-year period.
The basis for attaching value to a company is, to a great extent, tied to its earnings growth. It’s important for an investor to know whether the market has priced in the company's expected earnings growth (or decline). Doing so will help them establish if the stock's future looks promising or ominous. If you're wondering about Spire Healthcare Group's's valuation, check out this gauge of its price-to-earnings ratio, as compared to its industry.
Is Spire Healthcare Group Efficiently Re-investing Its Profits?
Spire Healthcare Group's low LTM (or last twelve month) payout ratio of 23% (implying that it retains the remaining 77% of its profits) comes as a surprise when you pair it with the shrinking earnings. This typically shouldn't be the case when a company is retaining most of its earnings. So there could be some other explanations in that regard. For example, the company's business may be deteriorating.
In addition, Spire Healthcare Group has been paying dividends over a period of eight years suggesting that keeping up dividend payments is preferred by the management even though earnings have been in decline. Our latest analyst data shows that the future payout ratio of the company is expected to rise to 29% over the next three years. Still, forecasts suggest that Spire Healthcare Group's future ROE will rise to 6.7% even though the the company's payout ratio is expected to rise. We presume that there could some other characteristics of the business that could be driving the anticipated growth in the company's ROE.
Conclusion
On the whole, we feel that the performance shown by Spire Healthcare Group can be open to many interpretations. While the company does have a high rate of reinvestment, the low ROE means that all that reinvestment is not reaping any benefit to its investors, and moreover, its having a negative impact on the earnings growth. Having said that, looking at current analyst estimates, we found that the company's earnings growth rate is expected to see a huge improvement. Are these analysts expectations based on the broad expectations for the industry, or on the company's fundamentals? Click here to be taken to our analyst's forecasts page for the company.
Have feedback on this article? Concerned about the content? Get in touch with us directly. Alternatively, email editorial-team (at) simplywallst.com.
This article by Simply Wall St is general in nature. We provide commentary based on historical data and analyst forecasts only using an unbiased methodology and our articles are not intended to be financial advice. It does not constitute a recommendation to buy or sell any stock, and does not take account of your objectives, or your financial situation. We aim to bring you long-term focused analysis driven by fundamental data. Note that our analysis may not factor in the latest price-sensitive company announcements or qualitative material. Simply Wall St has no position in any stocks mentioned.
Join A Paid User Research Session
You’ll receive a US$30 Amazon Gift card for 1 hour of your time while helping us build better investing tools for the individual investors like yourself. Sign up here
