
 Yahoo Finance
 Markel (MKL) Q1 Earnings, Revenues Miss Estimates, Rise Y/Y
Markel Group Inc. MKL reported first-quarter 2024 net operating earnings per share of $18.17, which missed the Zacks Consensus Estimate by 1.8%. The bottom line, however, increased 4.7% year over year.
Markel witnessed improved earned premiums and increased net investment income.
Quarterly Operational Update
Total operating revenues of $3.6 billion missed the Zacks Consensus Estimate by 1.5%. The top line rose 9% year over year.
Earned premiums increased 8.1% to $2.1 billion in the reported quarter.
Net investment income increased 37% year over year to $218 million in the fourth quarter.
Markel Group Inc. Price, Consensus and EPS Surprise
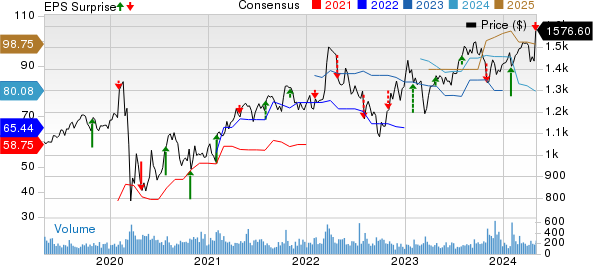
Markel Group Inc. price-consensus-eps-surprise-chart | Markel Group Inc. Quote
Total operating expenses increased 8.3% to $3.1 billion, owing to underwriting, acquisition and insurance expenses, product expenses, and services and other expenses.
MKL’s combined ratio deteriorated 120 basis points (bps) year over year to 95.2 in the reported quarter.
Segment Update
Insurance: Gross premiums increased 5% year over year to $2.2 billion. The uptick was driven by new business growth and more favorable rates within personal lines and program product lines, as well as increases in most classes of international portfolio.
Underwriting profit came in at $107.3 million, up 11% year over year. The combined ratio improved 10 bps year over year to 94.3.
Reinsurance: Gross premiums remained flat year over year at $553.3 billion. Higher gross premiums within marine and energy, general liability and credit and surety product lines were offset by a significant decline in gross premiums within professional liability product lines.
Underwriting profit was $12 million, down 50% year over year. The combined ratio deteriorated 470 bps year over year to 95.3 in the first quarter of 2024.
Markel Ventures: Operating revenues of $1.1 billion improved 3% year over year. The growth was driven by moderately higher revenues at consumer and building products businesses, construction services businesses and transportation-related businesses due to a combination of increased demand and higher prices.
Operating income of $103.9 million increased 13% year over year, driven by the impact of higher operating margins at consumer and building products businesses as a result of declines in the cost of materials, freight and labor, as well as higher revenues.
Financial Update
Markel exited the first quarter of 2024 with cash and cash equivalents of $4.3 billion, down 1.3% from the 2023 end level.
The debt balance increased 2% year over year to $3.9 billion as of Mar 31, 2024 from 2023 end level.
Shareholders' equity was $15.8 billion at first quarter 2024 end increased 5% from 2023 end.
Net cash provided by operating activities was $630.8 billion in the first quarter, more than double year over year, reflecting higher net premium collections.
Zacks Rank
Markel currently carries a Zacks Rank #4 (Sell).
You can see the complete list of today’s Zacks #1 Rank (Strong Buy) stocks here.
Performance of Some Other Diversified Operators
Danaher Corporation’s DHR first-quarter 2024 adjusted earnings (excluding 47 cents from non-recurring items) of $1.92 per share surpassed the Zacks Consensus Estimate of $1.72. The bottom line declined 27.1% year over year.
Danaher’s net sales of $5.8 billion outperformed the consensus estimate of $5.6 billion. However, the metric declined 2.5% year over year due to lower core sales in the Biotechnology segment. Organic sales in the quarter decreased 4%. Foreign-currency translations and acquisitions had a positive impact of 0.5% and 2.0%, respectively, on quarterly sales.
Danaher’s operating profit in the reported quarter dropped 13.5% year over year to $1.3 billion. Operating margin decreased to 22.6% from 25.5% in the year-ago quarter.
Honeywell International Inc. HON reported first-quarter 2024 adjusted earnings of $2.25 per share, which surpassed the Zacks Consensus Estimate of $2.18. The bottom line inched up 9% year over year on an adjusted basis. On a reported basis, the company’s earnings were $2.23 per share, indicating an increase of 8%.
Total revenues of $9.1 billion beat the consensus estimate of $9 billion. The top line inched up around 3% from the year-ago quarter, driven by strength in the Aerospace Technologies segment. Organic sales also increased 3% year over year. Operating income in the first quarter was $1.9 billion, up 9.9% year over year. The operating income margin was 20.4% compared with 19.1% in the year-ago period.
For 2024, Honeywell, currently expects sales of $38.1-$38.9 billion. Organic sales are expected to increase 4-6%. HON expects segment margin in the band of 23-23.3% compared with 22.7% in 2023. Adjusted earnings per share are expected to be between $9.80 and $10.10, higher than $9.16 in 2023. It expects operating cash flow in the range of $6.7-$7.1 billion for 2024, higher than $5.3 billion generated in 2023. Free cash flow is expected to be around $5.6-$6 billion.
3M Company MMM reported first-quarter 2024 results, wherein revenues and earnings surpassed the Zacks Consensus Estimate. Both the top and bottom lines (on adjusted basis) increased on a year-over-year basis. 3M delivered adjusted earnings of $2.39 per share, surpassing the Zacks Consensus Estimate of $2.08. The metric increased from $1.97 reported in the year-ago quarter.
MMM’s adjusted operating income in the quarter ascended 23.7% year over year to $1.71 billion. The adjusted operating margin was 21.9% compared with 17.9% in the year-ago quarter. The adjusted tax rate in the quarter was 20.5% compared with 17.7% in the year-ago period.
MMM expects 2024 adjusted earnings in the range of $6.80-$7.30 per share. The mid-point of the guided range is $7.05. Adjusted total sales are expected to be down 0.25% to up 1.75%. This implies an adjusted organic sales growth of 0-2%. 3M expects its dividend payout ratio to be approximately 40% of adjusted free cash flow.
Want the latest recommendations from Zacks Investment Research? Today, you can download 7 Best Stocks for the Next 30 Days. Click to get this free report
Honeywell International Inc. (HON) : Free Stock Analysis Report
3M Company (MMM) : Free Stock Analysis Report
Danaher Corporation (DHR) : Free Stock Analysis Report
Markel Group Inc. (MKL) : Free Stock Analysis Report
