
 Yahoo Finance
 Many Would Be Envious Of PWR Holdings' (ASX:PWH) Excellent Returns On Capital
Finding a business that has the potential to grow substantially is not easy, but it is possible if we look at a few key financial metrics. Firstly, we'd want to identify a growing return on capital employed (ROCE) and then alongside that, an ever-increasing base of capital employed. This shows us that it's a compounding machine, able to continually reinvest its earnings back into the business and generate higher returns. With that in mind, the ROCE of PWR Holdings (ASX:PWH) looks attractive right now, so lets see what the trend of returns can tell us.
Return On Capital Employed (ROCE): What is it?
For those who don't know, ROCE is a measure of a company's yearly pre-tax profit (its return), relative to the capital employed in the business. To calculate this metric for PWR Holdings, this is the formula:
Return on Capital Employed = Earnings Before Interest and Tax (EBIT) ÷ (Total Assets - Current Liabilities)
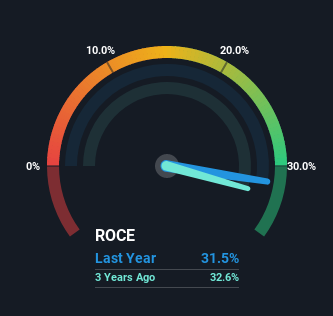
0.31 = AU$23m ÷ (AU$88m - AU$13m) (Based on the trailing twelve months to December 2021).
Therefore, PWR Holdings has an ROCE of 31%. In absolute terms that's a great return and it's even better than the Auto Components industry average of 13%.
See our latest analysis for PWR Holdings
In the above chart we have measured PWR Holdings' prior ROCE against its prior performance, but the future is arguably more important. If you'd like to see what analysts are forecasting going forward, you should check out our free report for PWR Holdings.
What Can We Tell From PWR Holdings' ROCE Trend?
It's hard not to be impressed by PWR Holdings' returns on capital. The company has employed 110% more capital in the last five years, and the returns on that capital have remained stable at 31%. Now considering ROCE is an attractive 31%, this combination is actually pretty appealing because it means the business can consistently put money to work and generate these high returns. You'll see this when looking at well operated businesses or favorable business models.
In Conclusion...
In the end, the company has proven it can reinvest it's capital at high rates of returns, which you'll remember is a trait of a multi-bagger. And long term investors would be thrilled with the 288% return they've received over the last five years. So while the positive underlying trends may be accounted for by investors, we still think this stock is worth looking into further.
If you'd like to know about the risks facing PWR Holdings, we've discovered 1 warning sign that you should be aware of.
High returns are a key ingredient to strong performance, so check out our free list ofstocks earning high returns on equity with solid balance sheets.
Have feedback on this article? Concerned about the content? Get in touch with us directly. Alternatively, email editorial-team (at) simplywallst.com.
This article by Simply Wall St is general in nature. We provide commentary based on historical data and analyst forecasts only using an unbiased methodology and our articles are not intended to be financial advice. It does not constitute a recommendation to buy or sell any stock, and does not take account of your objectives, or your financial situation. We aim to bring you long-term focused analysis driven by fundamental data. Note that our analysis may not factor in the latest price-sensitive company announcements or qualitative material. Simply Wall St has no position in any stocks mentioned.
