
 Yahoo Finance
 Many Would Be Envious Of Costco Wholesale's (NASDAQ:COST) Excellent Returns On Capital
What trends should we look for it we want to identify stocks that can multiply in value over the long term? Amongst other things, we'll want to see two things; firstly, a growing return on capital employed (ROCE) and secondly, an expansion in the company's amount of capital employed. Ultimately, this demonstrates that it's a business that is reinvesting profits at increasing rates of return. That's why when we briefly looked at Costco Wholesale's (NASDAQ:COST) ROCE trend, we were very happy with what we saw.
Understanding Return On Capital Employed (ROCE)
Just to clarify if you're unsure, ROCE is a metric for evaluating how much pre-tax income (in percentage terms) a company earns on the capital invested in its business. To calculate this metric for Costco Wholesale, this is the formula:
Return on Capital Employed = Earnings Before Interest and Tax (EBIT) ÷ (Total Assets - Current Liabilities)
0.23 = US$7.9b ÷ (US$67b - US$33b) (Based on the trailing twelve months to February 2023).
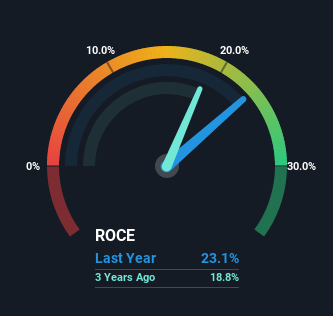
So, Costco Wholesale has an ROCE of 23%. In absolute terms that's a great return and it's even better than the Consumer Retailing industry average of 12%.
Check out our latest analysis for Costco Wholesale
In the above chart we have measured Costco Wholesale's prior ROCE against its prior performance, but the future is arguably more important. If you'd like to see what analysts are forecasting going forward, you should check out our free report for Costco Wholesale.
The Trend Of ROCE
It's hard not to be impressed by Costco Wholesale's returns on capital. The company has employed 74% more capital in the last five years, and the returns on that capital have remained stable at 23%. With returns that high, it's great that the business can continually reinvest its money at such appealing rates of return. You'll see this when looking at well operated businesses or favorable business models.
On a side note, Costco Wholesale's current liabilities are still rather high at 49% of total assets. This can bring about some risks because the company is basically operating with a rather large reliance on its suppliers or other sorts of short-term creditors. While it's not necessarily a bad thing, it can be beneficial if this ratio is lower.
The Key Takeaway
In summary, we're delighted to see that Costco Wholesale has been compounding returns by reinvesting at consistently high rates of return, as these are common traits of a multi-bagger. And long term investors would be thrilled with the 171% return they've received over the last five years. So while investors seem to be recognizing these promising trends, we still believe the stock deserves further research.
If you'd like to know about the risks facing Costco Wholesale, we've discovered 1 warning sign that you should be aware of.
If you'd like to see other companies earning high returns, check out our free list of companies earning high returns with solid balance sheets here.
Have feedback on this article? Concerned about the content? Get in touch with us directly. Alternatively, email editorial-team (at) simplywallst.com.
This article by Simply Wall St is general in nature. We provide commentary based on historical data and analyst forecasts only using an unbiased methodology and our articles are not intended to be financial advice. It does not constitute a recommendation to buy or sell any stock, and does not take account of your objectives, or your financial situation. We aim to bring you long-term focused analysis driven by fundamental data. Note that our analysis may not factor in the latest price-sensitive company announcements or qualitative material. Simply Wall St has no position in any stocks mentioned.
Join A Paid User Research Session
You’ll receive a US$30 Amazon Gift card for 1 hour of your time while helping us build better investing tools for the individual investors like yourself. Sign up here
