
 Yahoo Finance
 Is The Manitowoc Company, Inc. (NYSE:MTW) Overpaying Its CEO?
Barry Pennypacker has been the CEO of The Manitowoc Company, Inc. (NYSE:MTW) since 2016. First, this article will compare CEO compensation with compensation at similar sized companies. Then we'll look at a snap shot of the business growth. And finally - as a second measure of performance - we will look at the returns shareholders have received over the last few years. This method should give us information to assess how appropriately the company pays the CEO.
See our latest analysis for Manitowoc Company
How Does Barry Pennypacker's Compensation Compare With Similar Sized Companies?
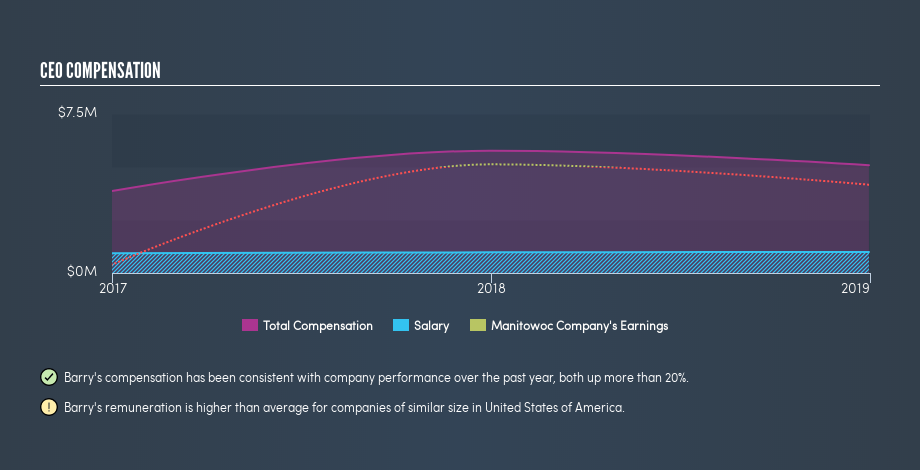
At the time of writing our data says that The Manitowoc Company, Inc. has a market cap of US$522m, and is paying total annual CEO compensation of US$5.1m. (This figure is for the year to December 2018). We think total compensation is more important but we note that the CEO salary is lower, at US$996k. We examined companies with market caps from US$200m to US$800m, and discovered that the median CEO total compensation of that group was US$1.8m.
Thus we can conclude that Barry Pennypacker receives more in total compensation than the median of a group of companies in the same market, and of similar size to The Manitowoc Company, Inc.. However, this doesn't necessarily mean the pay is too high. A closer look at the performance of the underlying business will give us a better idea about whether the pay is particularly generous.
You can see, below, how CEO compensation at Manitowoc Company has changed over time.
Is The Manitowoc Company, Inc. Growing?
On average over the last three years, The Manitowoc Company, Inc. has grown earnings per share (EPS) by 83% each year (using a line of best fit). It achieved revenue growth of 7.1% over the last year.
This demonstrates that the company has been improving recently. A good result. It's nice to see a little revenue growth, as this is consistent with healthy business conditions. Shareholders might be interested in this free visualization of analyst forecasts.
Has The Manitowoc Company, Inc. Been A Good Investment?
With a three year total loss of 27%, The Manitowoc Company, Inc. would certainly have some dissatisfied shareholders. So shareholders would probably think the company shouldn't be too generous with CEO compensation.
In Summary...
We examined the amount The Manitowoc Company, Inc. pays its CEO, and compared it to the amount paid by similar sized companies. Our data suggests that it pays above the median CEO pay within that group.
However we must not forget that the EPS growth has been very strong over three years. However, the returns to investors are far less impressive, over the same period. While EPS is positive, we'd say shareholders would want better returns before the CEO is paid much more. So you may want to check if insiders are buying Manitowoc Company shares with their own money (free access).
Important note: Manitowoc Company may not be the best stock to buy. You might find something better in this list of interesting companies with high ROE and low debt.
We aim to bring you long-term focused research analysis driven by fundamental data. Note that our analysis may not factor in the latest price-sensitive company announcements or qualitative material.
If you spot an error that warrants correction, please contact the editor at editorial-team@simplywallst.com. This article by Simply Wall St is general in nature. It does not constitute a recommendation to buy or sell any stock, and does not take account of your objectives, or your financial situation. Simply Wall St has no position in the stocks mentioned. Thank you for reading.
