
 Yahoo Finance
 What Makes TELUS Corporation (TSE:T) A Great Dividend Stock?

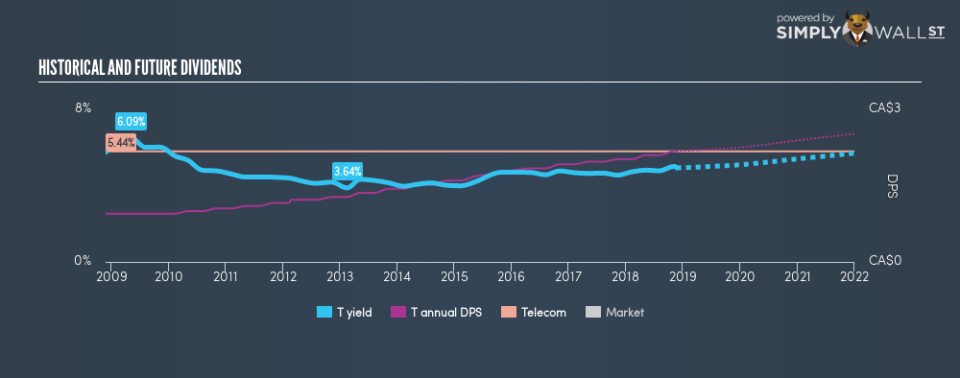
Over the past 10 years TELUS Corporation (TSE:T) has been paying dividends to shareholders. The stock currently pays out a dividend yield of 4.6%, and has a market cap of CA$28b. Does TELUS tick all the boxes of a great dividend stock? Below, I’ll take you through my analysis.
Check out our latest analysis for TELUS
5 checks you should use to assess a dividend stock
Whenever I am looking at a potential dividend stock investment, I always check these five metrics:
Is it the top 25% annual dividend yield payer?
Has its dividend been stable over the past (i.e. no missed payments or significant payout cuts)?
Has dividend per share risen in the past couple of years?
Is its earnings sufficient to payout dividend at the current rate?
Will it have the ability to keep paying its dividends going forward?
How well does TELUS fit our criteria?
TELUS has a trailing twelve-month payout ratio of 82%, meaning the dividend is sufficiently covered by earnings. However, going forward, analysts expect T’s payout to fall to 73% of its earnings, which leads to a dividend yield of 4.8%. However, EPS should increase to CA$2.83, meaning that the lower payout ratio does not necessarily implicate a lower dividend payment.
When thinking about whether a dividend is sustainable, another factor to consider is the cash flow. Cash flow is important because companies with strong cash flow can usually sustain higher payout ratios.
If there is one thing that you want to be reliable in your life, it’s dividend stocks and their constant income stream. In the case of T it has increased its DPS from CA$0.95 to CA$2.18 in the past 10 years. During this period it has not missed a payment, as one would expect for a company increasing its dividend. These are all positive signs of a great, reliable dividend stock.
Relative to peers, TELUS generates a yield of 4.6%, which is on the low-side for Telecom stocks.
Next Steps:
With these dividend metrics in mind, I definitely rank TELUS as a strong income stock, and is worth further research for anyone who considers dividends an important part of their portfolio strategy. Given that this is purely a dividend analysis, I recommend taking sufficient time to understand its core business and determine whether the company and its investment properties suit your overall goals. I’ve put together three important factors you should further research:
Future Outlook: What are well-informed industry analysts predicting for T’s future growth? Take a look at our free research report of analyst consensus for T’s outlook.
Valuation: What is T worth today? Even if the stock is a cash cow, it’s not worth an infinite price. The intrinsic value infographic in our free research report helps visualize whether T is currently mispriced by the market.
Other Dividend Rockstars: Are there better dividend payers with stronger fundamentals out there? Check out our free list of these great stocks here.
To help readers see past the short term volatility of the financial market, we aim to bring you a long-term focused research analysis purely driven by fundamental data. Note that our analysis does not factor in the latest price-sensitive company announcements.
The author is an independent contributor and at the time of publication had no position in the stocks mentioned. For errors that warrant correction please contact the editor at editorial-team@simplywallst.com.
