
 Yahoo Finance
 Majestic Gold (CVE:MJS) Might Have The Makings Of A Multi-Bagger
If we want to find a stock that could multiply over the long term, what are the underlying trends we should look for? Firstly, we'll want to see a proven return on capital employed (ROCE) that is increasing, and secondly, an expanding base of capital employed. Put simply, these types of businesses are compounding machines, meaning they are continually reinvesting their earnings at ever-higher rates of return. So on that note, Majestic Gold (CVE:MJS) looks quite promising in regards to its trends of return on capital.
Return On Capital Employed (ROCE): What Is It?
For those that aren't sure what ROCE is, it measures the amount of pre-tax profits a company can generate from the capital employed in its business. Analysts use this formula to calculate it for Majestic Gold:
Return on Capital Employed = Earnings Before Interest and Tax (EBIT) ÷ (Total Assets - Current Liabilities)
0.18 = US$22m ÷ (US$146m - US$23m) (Based on the trailing twelve months to June 2023).
Thus, Majestic Gold has an ROCE of 18%. In absolute terms, that's a satisfactory return, but compared to the Metals and Mining industry average of 3.7% it's much better.
Check out our latest analysis for Majestic Gold
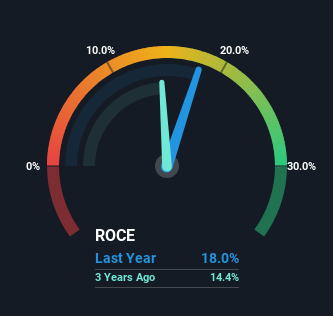
Historical performance is a great place to start when researching a stock so above you can see the gauge for Majestic Gold's ROCE against it's prior returns. If you want to delve into the historical earnings, revenue and cash flow of Majestic Gold, check out these free graphs here.
What Can We Tell From Majestic Gold's ROCE Trend?
We like the trends that we're seeing from Majestic Gold. Over the last five years, returns on capital employed have risen substantially to 18%. Basically the business is earning more per dollar of capital invested and in addition to that, 39% more capital is being employed now too. The increasing returns on a growing amount of capital is common amongst multi-baggers and that's why we're impressed.
In another part of our analysis, we noticed that the company's ratio of current liabilities to total assets decreased to 16%, which broadly means the business is relying less on its suppliers or short-term creditors to fund its operations. So shareholders would be pleased that the growth in returns has mostly come from underlying business performance.
The Bottom Line On Majestic Gold's ROCE
To sum it up, Majestic Gold has proven it can reinvest in the business and generate higher returns on that capital employed, which is terrific. Considering the stock has delivered 23% to its stockholders over the last five years, it may be fair to think that investors aren't fully aware of the promising trends yet. Given that, we'd look further into this stock in case it has more traits that could make it multiply in the long term.
One more thing, we've spotted 2 warning signs facing Majestic Gold that you might find interesting.
While Majestic Gold isn't earning the highest return, check out this free list of companies that are earning high returns on equity with solid balance sheets.
Have feedback on this article? Concerned about the content? Get in touch with us directly. Alternatively, email editorial-team (at) simplywallst.com.
This article by Simply Wall St is general in nature. We provide commentary based on historical data and analyst forecasts only using an unbiased methodology and our articles are not intended to be financial advice. It does not constitute a recommendation to buy or sell any stock, and does not take account of your objectives, or your financial situation. We aim to bring you long-term focused analysis driven by fundamental data. Note that our analysis may not factor in the latest price-sensitive company announcements or qualitative material. Simply Wall St has no position in any stocks mentioned.
