
 Yahoo Finance
 Is Magna International Inc.'s (TSE:MG) Recent Price Movement Underpinned By Its Weak Fundamentals?
Magna International (TSE:MG) has had a rough week with its share price down 4.6%. We, however decided to study the company's financials to determine if they have got anything to do with the price decline. Stock prices are usually driven by a company’s financial performance over the long term, and therefore we decided to pay more attention to the company's financial performance. Particularly, we will be paying attention to Magna International's ROE today.
ROE or return on equity is a useful tool to assess how effectively a company can generate returns on the investment it received from its shareholders. Simply put, it is used to assess the profitability of a company in relation to its equity capital.
View our latest analysis for Magna International
How Is ROE Calculated?
The formula for return on equity is:
Return on Equity = Net Profit (from continuing operations) ÷ Shareholders' Equity
So, based on the above formula, the ROE for Magna International is:
8.7% = US$1.0b ÷ US$12b (Based on the trailing twelve months to March 2021).
The 'return' refers to a company's earnings over the last year. So, this means that for every CA$1 of its shareholder's investments, the company generates a profit of CA$0.09.
What Is The Relationship Between ROE And Earnings Growth?
Thus far, we have learned that ROE measures how efficiently a company is generating its profits. We now need to evaluate how much profit the company reinvests or "retains" for future growth which then gives us an idea about the growth potential of the company. Generally speaking, other things being equal, firms with a high return on equity and profit retention, have a higher growth rate than firms that don’t share these attributes.
Magna International's Earnings Growth And 8.7% ROE
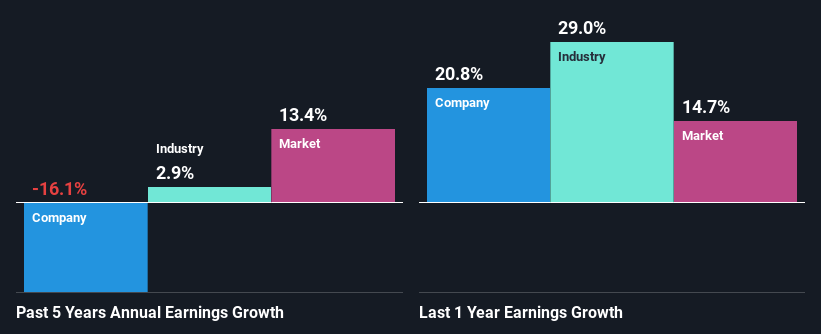
When you first look at it, Magna International's ROE doesn't look that attractive. However, given that the company's ROE is similar to the average industry ROE of 11%, we may spare it some thought. Having said that, Magna International's five year net income decline rate was 16%. Remember, the company's ROE is a bit low to begin with. Therefore, the decline in earnings could also be the result of this.
Next, when we compared with the industry, which has shrunk its earnings at a rate of 11% in the same period, we still found Magna International's performance to be quite bleak, because the company has been shrinking its earnings faster than the industry.
Earnings growth is an important metric to consider when valuing a stock. What investors need to determine next is if the expected earnings growth, or the lack of it, is already built into the share price. This then helps them determine if the stock is placed for a bright or bleak future. What is MG worth today? The intrinsic value infographic in our free research report helps visualize whether MG is currently mispriced by the market.
Is Magna International Making Efficient Use Of Its Profits?
Magna International's low three-year median payout ratio of 20% (implying that it retains the remaining 80% of its profits) comes as a surprise when you pair it with the shrinking earnings. This typically shouldn't be the case when a company is retaining most of its earnings. So there could be some other explanations in that regard. For example, the company's business may be deteriorating.
Additionally, Magna International has paid dividends over a period of at least ten years, which means that the company's management is determined to pay dividends even if it means little to no earnings growth. Based on the latest analysts' estimates, we found that the company's future payout ratio over the next three years is expected to hold steady at 19%. Still, forecasts suggest that Magna International's future ROE will rise to 20% even though the the company's payout ratio is not expected to change by much.
Summary
In total, we're a bit ambivalent about Magna International's performance. While the company does have a high rate of profit retention, its low rate of return is probably hampering its earnings growth. That being so, the latest industry analyst forecasts show that the analysts are expecting to see a huge improvement in the company's earnings growth rate. To know more about the company's future earnings growth forecasts take a look at this free report on analyst forecasts for the company to find out more.
This article by Simply Wall St is general in nature. It does not constitute a recommendation to buy or sell any stock, and does not take account of your objectives, or your financial situation. We aim to bring you long-term focused analysis driven by fundamental data. Note that our analysis may not factor in the latest price-sensitive company announcements or qualitative material. Simply Wall St has no position in any stocks mentioned.
Have feedback on this article? Concerned about the content? Get in touch with us directly. Alternatively, email editorial-team (at) simplywallst.com.
