
 Yahoo Finance
 Mühlbauer Holding (ETR:MUB) Could Be Struggling To Allocate Capital
To find a multi-bagger stock, what are the underlying trends we should look for in a business? Firstly, we'll want to see a proven return on capital employed (ROCE) that is increasing, and secondly, an expanding base of capital employed. Put simply, these types of businesses are compounding machines, meaning they are continually reinvesting their earnings at ever-higher rates of return. Although, when we looked at Mühlbauer Holding (ETR:MUB), it didn't seem to tick all of these boxes.
Return On Capital Employed (ROCE): What Is It?
For those who don't know, ROCE is a measure of a company's yearly pre-tax profit (its return), relative to the capital employed in the business. The formula for this calculation on Mühlbauer Holding is:
Return on Capital Employed = Earnings Before Interest and Tax (EBIT) ÷ (Total Assets - Current Liabilities)
0.04 = €24m ÷ (€605m - €3.4m) (Based on the trailing twelve months to June 2023).
Therefore, Mühlbauer Holding has an ROCE of 4.0%. Ultimately, that's a low return and it under-performs the Machinery industry average of 11%.
See our latest analysis for Mühlbauer Holding
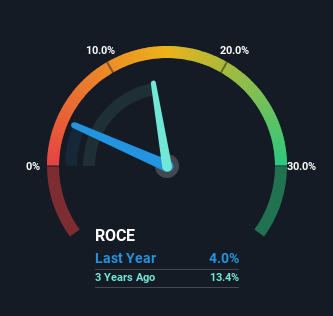
Historical performance is a great place to start when researching a stock so above you can see the gauge for Mühlbauer Holding's ROCE against it's prior returns. If you want to delve into the historical earnings, revenue and cash flow of Mühlbauer Holding, check out these free graphs here.
The Trend Of ROCE
In terms of Mühlbauer Holding's historical ROCE movements, the trend isn't fantastic. Over the last five years, returns on capital have decreased to 4.0% from 14% five years ago. However, given capital employed and revenue have both increased it appears that the business is currently pursuing growth, at the consequence of short term returns. And if the increased capital generates additional returns, the business, and thus shareholders, will benefit in the long run.
On a side note, Mühlbauer Holding has done well to pay down its current liabilities to 0.6% of total assets. That could partly explain why the ROCE has dropped. Effectively this means their suppliers or short-term creditors are funding less of the business, which reduces some elements of risk. Since the business is basically funding more of its operations with it's own money, you could argue this has made the business less efficient at generating ROCE.
The Key Takeaway
Even though returns on capital have fallen in the short term, we find it promising that revenue and capital employed have both increased for Mühlbauer Holding. Furthermore the stock has climbed 80% over the last five years, it would appear that investors are upbeat about the future. So while investors seem to be recognizing these promising trends, we would look further into this stock to make sure the other metrics justify the positive view.
One final note, you should learn about the 3 warning signs we've spotted with Mühlbauer Holding (including 1 which is a bit concerning) .
While Mühlbauer Holding may not currently earn the highest returns, we've compiled a list of companies that currently earn more than 25% return on equity. Check out this free list here.
Have feedback on this article? Concerned about the content? Get in touch with us directly. Alternatively, email editorial-team (at) simplywallst.com.
This article by Simply Wall St is general in nature. We provide commentary based on historical data and analyst forecasts only using an unbiased methodology and our articles are not intended to be financial advice. It does not constitute a recommendation to buy or sell any stock, and does not take account of your objectives, or your financial situation. We aim to bring you long-term focused analysis driven by fundamental data. Note that our analysis may not factor in the latest price-sensitive company announcements or qualitative material. Simply Wall St has no position in any stocks mentioned.
