
 Yahoo Finance
 Lundin Mining Corporation (TSE:LUN): Financial Strength Analysis

Stocks with market capitalization between $2B and $10B, such as Lundin Mining Corporation (TSE:LUN) with a size of CA$4.0b, do not attract as much attention from the investing community as do the small-caps and large-caps. However, generally ignored mid-caps have historically delivered better risk-adjusted returns than the two other categories of stocks. Let’s take a look at LUN’s debt concentration and assess their financial liquidity to get an idea of their ability to fund strategic acquisitions and grow through cyclical pressures. Remember this is a very top-level look that focuses exclusively on financial health, so I recommend a deeper analysis into LUN here.
See our latest analysis for Lundin Mining
How much cash does LUN generate through its operations?
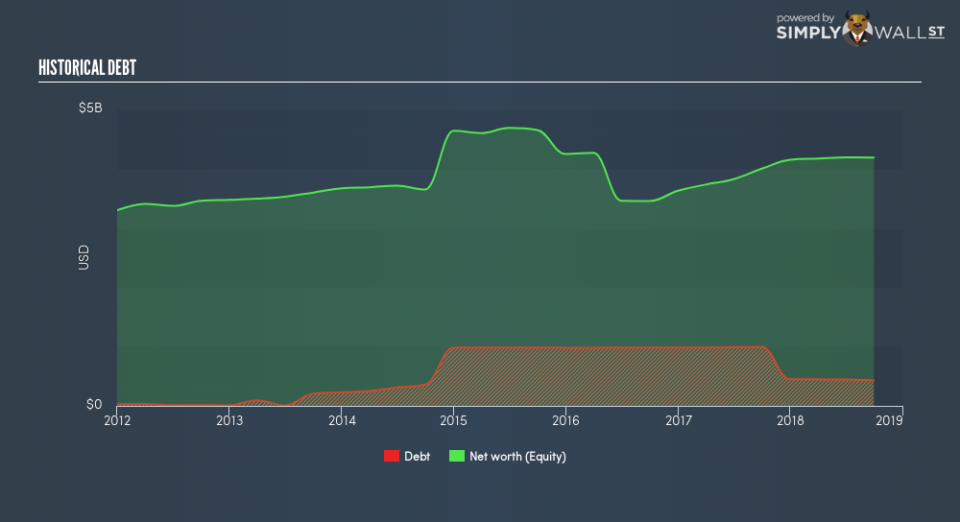
LUN’s debt levels have fallen from US$994m to US$433m over the last 12 months , which also accounts for long term debt. With this debt repayment, LUN’s cash and short-term investments stands at US$1.5b , ready to deploy into the business. Moreover, LUN has generated cash from operations of US$662m over the same time period, leading to an operating cash to total debt ratio of 153%, indicating that LUN’s operating cash is sufficient to cover its debt. This ratio can also be interpreted as a measure of efficiency as an alternative to return on assets. In LUN’s case, it is able to generate 1.53x cash from its debt capital.
Can LUN meet its short-term obligations with the cash in hand?
At the current liabilities level of US$459m, it appears that the company has been able to meet these obligations given the level of current assets of US$2.0b, with a current ratio of 4.37x. Having said that, many consider a ratio above 3x to be high, although this is not necessarily a bad thing.
Does LUN face the risk of succumbing to its debt-load?
With debt at 10% of equity, LUN may be thought of as appropriately levered. LUN is not taking on too much debt commitment, which may be constraining for future growth. We can test if LUN’s debt levels are sustainable by measuring interest payments against earnings of a company. Ideally, earnings before interest and tax (EBIT) should cover net interest by at least three times. For LUN, the ratio of 8.56x suggests that interest is appropriately covered, which means that debtors may be willing to loan the company more money, giving LUN ample headroom to grow its debt facilities.
Next Steps:
LUN has demonstrated its ability to generate sufficient levels of cash flow, while its debt hovers at a safe level. Furthermore, the company exhibits an ability to meet its near term obligations should an adverse event occur. I admit this is a fairly basic analysis for LUN’s financial health. Other important fundamentals need to be considered alongside. I suggest you continue to research Lundin Mining to get a better picture of the stock by looking at:
Future Outlook: What are well-informed industry analysts predicting for LUN’s future growth? Take a look at our free research report of analyst consensus for LUN’s outlook.
Valuation: What is LUN worth today? Is the stock undervalued, even when its growth outlook is factored into its intrinsic value? The intrinsic value infographic in our free research report helps visualize whether LUN is currently mispriced by the market.
Other High-Performing Stocks: Are there other stocks that provide better prospects with proven track records? Explore our free list of these great stocks here.
To help readers see past the short term volatility of the financial market, we aim to bring you a long-term focused research analysis purely driven by fundamental data. Note that our analysis does not factor in the latest price-sensitive company announcements.
The author is an independent contributor and at the time of publication had no position in the stocks mentioned. For errors that warrant correction please contact the editor at editorial-team@simplywallst.com.
