
 Yahoo Finance
 Lululemon Athletica (NASDAQ:LULU) sheds 3.3% this week, as yearly returns fall more in line with earnings growth
While Lululemon Athletica Inc. (NASDAQ:LULU) shareholders are probably generally happy, the stock hasn't had particularly good run recently, with the share price falling 26% in the last quarter. But that doesn't undermine the fantastic longer term performance (measured over five years). In fact, during that period, the share price climbed 376%. Impressive! So it might be that some shareholders are taking profits after good performance. Only time will tell if there is still too much optimism currently reflected in the share price.
Although Lululemon Athletica has shed US$1.4b from its market cap this week, let's take a look at its longer term fundamental trends and see if they've driven returns.
Check out our latest analysis for Lululemon Athletica
To paraphrase Benjamin Graham: Over the short term the market is a voting machine, but over the long term it's a weighing machine. By comparing earnings per share (EPS) and share price changes over time, we can get a feel for how investor attitudes to a company have morphed over time.
Over half a decade, Lululemon Athletica managed to grow its earnings per share at 27% a year. This EPS growth is lower than the 37% average annual increase in the share price. So it's fair to assume the market has a higher opinion of the business than it did five years ago. That's not necessarily surprising considering the five-year track record of earnings growth. This favorable sentiment is reflected in its (fairly optimistic) P/E ratio of 47.76.
You can see below how EPS has changed over time (discover the exact values by clicking on the image).
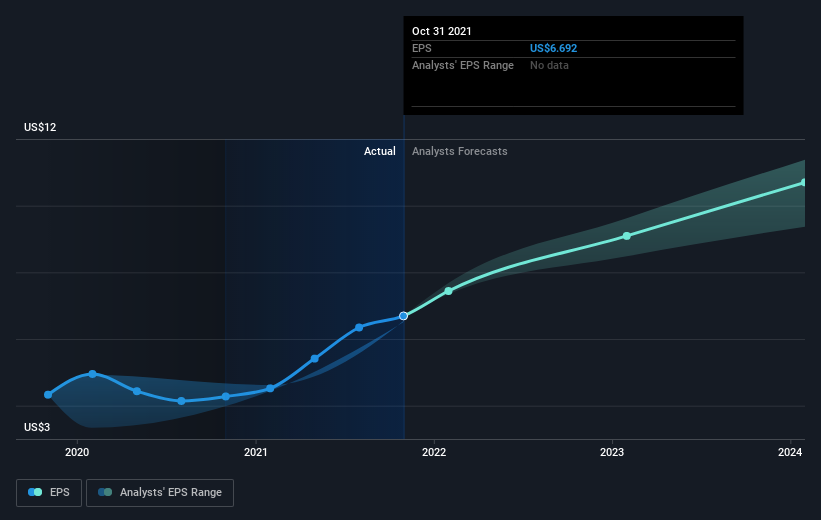
We like that insiders have been buying shares in the last twelve months. Even so, future earnings will be far more important to whether current shareholders make money. It might be well worthwhile taking a look at our free report on Lululemon Athletica's earnings, revenue and cash flow.
A Different Perspective
Investors in Lululemon Athletica had a tough year, with a total loss of 2.7%, against a market gain of about 5.7%. Even the share prices of good stocks drop sometimes, but we want to see improvements in the fundamental metrics of a business, before getting too interested. Longer term investors wouldn't be so upset, since they would have made 37%, each year, over five years. If the fundamental data continues to indicate long term sustainable growth, the current sell-off could be an opportunity worth considering. While it is well worth considering the different impacts that market conditions can have on the share price, there are other factors that are even more important. For example, we've discovered 1 warning sign for Lululemon Athletica that you should be aware of before investing here.
Lululemon Athletica is not the only stock that insiders are buying. For those who like to find winning investments this free list of growing companies with recent insider purchasing, could be just the ticket.
Please note, the market returns quoted in this article reflect the market weighted average returns of stocks that currently trade on US exchanges.
Have feedback on this article? Concerned about the content? Get in touch with us directly. Alternatively, email editorial-team (at) simplywallst.com.
This article by Simply Wall St is general in nature. We provide commentary based on historical data and analyst forecasts only using an unbiased methodology and our articles are not intended to be financial advice. It does not constitute a recommendation to buy or sell any stock, and does not take account of your objectives, or your financial situation. We aim to bring you long-term focused analysis driven by fundamental data. Note that our analysis may not factor in the latest price-sensitive company announcements or qualitative material. Simply Wall St has no position in any stocks mentioned.