
 Yahoo Finance
 Loss-Making Mawson Infrastructure Group Inc. (NASDAQ:MIGI) Expected To Breakeven In The Medium-Term
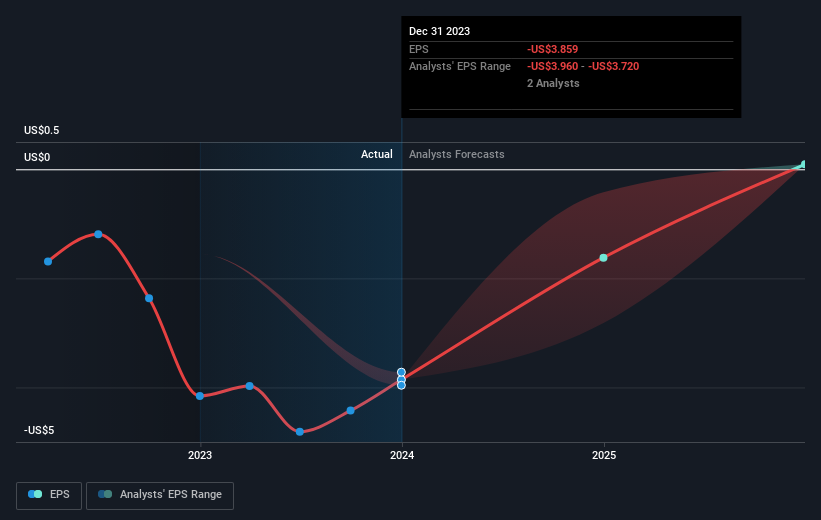
With the business potentially at an important milestone, we thought we'd take a closer look at Mawson Infrastructure Group Inc.'s (NASDAQ:MIGI) future prospects. Mawson Infrastructure Group, Inc., a digital infrastructure provider, operates in cryptocurrency mining business in the United States and Australia. On 31 December 2023, the US$23m market-cap company posted a loss of US$60m for its most recent financial year. Many investors are wondering about the rate at which Mawson Infrastructure Group will turn a profit, with the big question being “when will the company breakeven?” Below we will provide a high-level summary of the industry analysts’ expectations for the company.
View our latest analysis for Mawson Infrastructure Group
Consensus from 2 of the American Software analysts is that Mawson Infrastructure Group is on the verge of breakeven. They anticipate the company to incur a final loss in 2024, before generating positive profits of US$4.1m in 2025. The company is therefore projected to breakeven just over a year from now. What rate will the company have to grow year-on-year in order to breakeven on this date? Using a line of best fit, we calculated an average annual growth rate of 96%, which is rather optimistic! Should the business grow at a slower rate, it will become profitable at a later date than expected.
Underlying developments driving Mawson Infrastructure Group's growth isn’t the focus of this broad overview, however, bear in mind that by and large a high forecast growth rate is not unusual for a company that is currently undergoing an investment period.
One thing we would like to bring into light with Mawson Infrastructure Group is its relatively high level of debt. Typically, debt shouldn’t exceed 40% of your equity, which in Mawson Infrastructure Group's case is 64%. Note that a higher debt obligation increases the risk around investing in the loss-making company.
Next Steps:
There are key fundamentals of Mawson Infrastructure Group which are not covered in this article, but we must stress again that this is merely a basic overview. For a more comprehensive look at Mawson Infrastructure Group, take a look at Mawson Infrastructure Group's company page on Simply Wall St. We've also compiled a list of relevant aspects you should further examine:
Historical Track Record: What has Mawson Infrastructure Group's performance been like over the past? Go into more detail in the past track record analysis and take a look at the free visual representations of our analysis for more clarity.
Management Team: An experienced management team on the helm increases our confidence in the business – take a look at who sits on Mawson Infrastructure Group's board and the CEO’s background.
Other High-Performing Stocks: Are there other stocks that provide better prospects with proven track records? Explore our free list of these great stocks here.
Have feedback on this article? Concerned about the content? Get in touch with us directly. Alternatively, email editorial-team (at) simplywallst.com.
This article by Simply Wall St is general in nature. We provide commentary based on historical data and analyst forecasts only using an unbiased methodology and our articles are not intended to be financial advice. It does not constitute a recommendation to buy or sell any stock, and does not take account of your objectives, or your financial situation. We aim to bring you long-term focused analysis driven by fundamental data. Note that our analysis may not factor in the latest price-sensitive company announcements or qualitative material. Simply Wall St has no position in any stocks mentioned.
