
 Yahoo Finance
 L'Oreal SA's Dividend Analysis
Assessing the Sustainability and Growth of L'Oreal SA's Dividends
L'Oreal SA (LRLCY) recently announced a dividend of $1.42 per share, payable on 2024-05-21, with the ex-dividend date set for 2024-04-24. As investors look forward to this upcoming payment, the spotlight also shines on the company's dividend history, yield, and growth rates. Using the data from GuruFocus, let's look into L'Oreal SA's dividend performance and assess its sustainability.
What Does L'Oreal SA Do?
This Powerful Chart Made Peter Lynch 29% A Year For 13 Years
How to calculate the intrinsic value of a stock?
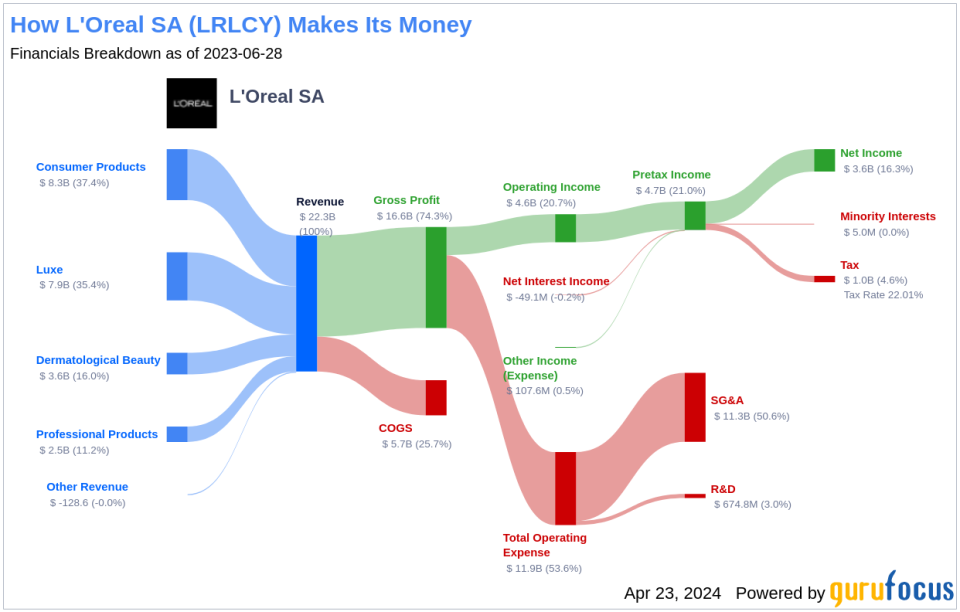
Founded in 1909, L'Oreal has grown into the largest beauty company in the world, participating in categories including skincare (40% of sales), makeup (20%), haircare (27%), fragrance (9%), and sanitary products (4%). The firm also has a diversified geographic footprint, generating 32% of sales in its home market of Western Europe, 27% from North America, 26% in North Asia, and the rest from various emerging markets across South Asia, Latin America, and Africa. L'Oreal owns a mix of premium and mass beauty brands sold through a wide range of channels such as mass retail, drugstores, department stores, travel retail, e-commerce, hair salons, and medi-spas. Leading brands include Lancome, Yves Saint Laurent, Maybelline, Kiehl's, L'Oreal Paris, Kerastase, CeraVe, Garnier, and Armani.
A Glimpse at L'Oreal SA's Dividend History
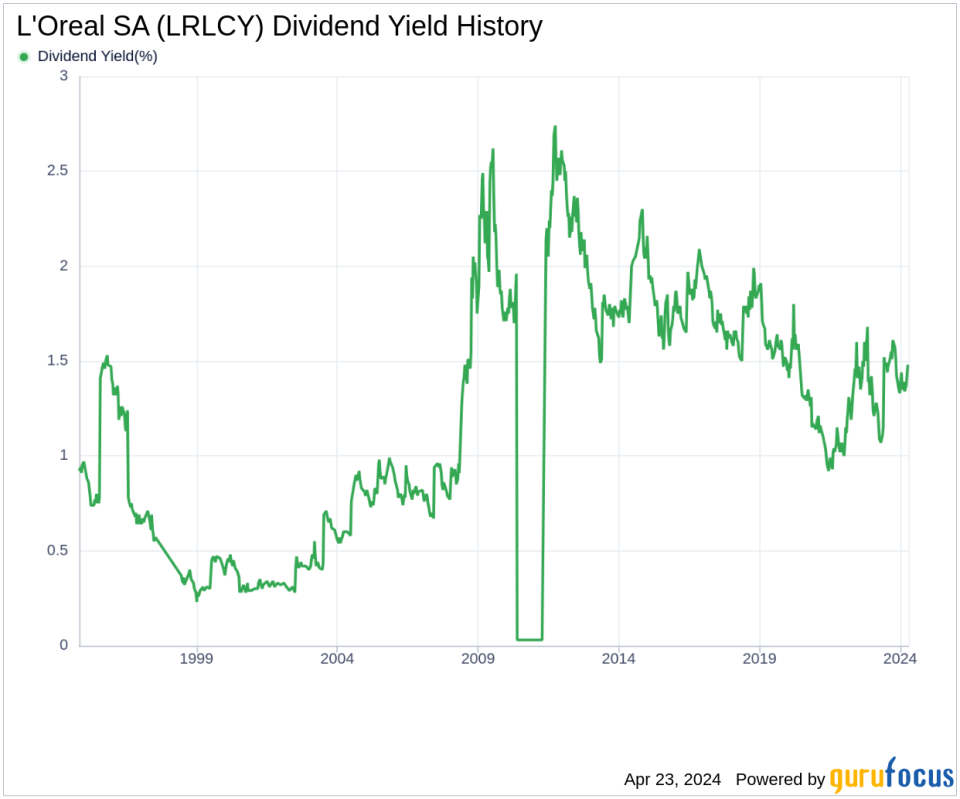
L'Oreal SA has maintained a consistent dividend payment record since 1998. Dividends are currently distributed on a yearly basis. Below is a chart showing annual Dividends Per Share for tracking historical trends.
Breaking Down L'Oreal SA's Dividend Yield and Growth
As of today, L'Oreal SA currently has a 12-month trailing dividend yield of 1.41% and a 12-month forward dividend yield of 1.52%. This suggests an expectation of increased dividend payments over the next 12 months. Over the past three years, L'Oreal SA's annual dividend growth rate was 15.90%. Extended to a five-year horizon, this rate decreased to 10.00% per year. And over the past decade, L'Oreal SA's annual dividends per share growth rate stands at 8.70%.
Based on L'Oreal SA's dividend yield and five-year growth rate, the 5-year yield on cost of L'Oreal SA stock as of today is approximately 2.27%.
The Sustainability Question: Payout Ratio and Profitability
To assess the sustainability of the dividend, one needs to evaluate the company's payout ratio. The dividend payout ratio provides insights into the portion of earnings the company distributes as dividends. A lower ratio suggests that the company retains a significant part of its earnings, thereby ensuring the availability of funds for future growth and unexpected downturns. As of 2023-12-31, L'Oreal SA's dividend payout ratio is 0.49.
L'Oreal SA's profitability rank, offers an understanding of the company's earnings prowess relative to its peers. GuruFocus ranks L'Oreal SA's profitability 9 out of 10 as of 2023-12-31, suggesting good profitability prospects. The company has reported positive net income for each year over the past decade, further solidifying its high profitability.
Growth Metrics: The Future Outlook
To ensure the sustainability of dividends, a company must have robust growth metrics. L'Oreal SA's growth rank of 9 out of 10 suggests that the company's growth trajectory is good relative to its competitors.
Revenue is the lifeblood of any company, and L'Oreal SA's revenue per share, combined with the 3-year revenue growth rate, indicates a strong revenue model. L'Oreal SA's revenue has increased by approximately 15.40% per year on average, a rate that outperforms approximately 73.07% of global competitors.
The company's 3-year EPS growth rate showcases its capability to grow its earnings, a critical component for sustaining dividends in the long run. During the past three years, L'Oreal SA's earnings increased by approximately 18.30% per year on average, a rate that outperforms approximately 62.47% of global competitors.
Lastly, the company's 5-year EBITDA growth rate of 12.10%, which outperforms approximately 62.42% of global competitors.
Next Steps
In conclusion, L'Oreal SA's upcoming dividend, along with its historical dividend growth, presents an attractive proposition for value investors. The company's prudent payout ratio and strong profitability rank indicate a sustainable dividend policy. Moreover, L'Oreal SA's robust growth metrics provide confidence in the company's future prospects, potentially leading to continued dividend increases. Investors considering adding a beauty industry titan to their portfolios with a steady dividend income stream may find L'Oreal SA a compelling choice. For further investment opportunities, GuruFocus Premium users can explore the High Dividend Yield Screener for high-dividend yield stocks.
This article, generated by GuruFocus, is designed to provide general insights and is not tailored financial advice. Our commentary is rooted in historical data and analyst projections, utilizing an impartial methodology, and is not intended to serve as specific investment guidance. It does not formulate a recommendation to purchase or divest any stock and does not consider individual investment objectives or financial circumstances. Our objective is to deliver long-term, fundamental data-driven analysis. Be aware that our analysis might not incorporate the most recent, price-sensitive company announcements or qualitative information. GuruFocus holds no position in the stocks mentioned herein.
This article first appeared on GuruFocus.
