
 Yahoo Finance
 A Look At Marcus & Millichap's (NYSE:MMI) Share Price Returns

Ideally, your overall portfolio should beat the market average. But the main game is to find enough winners to more than offset the losers So we wouldn't blame long term Marcus & Millichap, Inc. (NYSE:MMI) shareholders for doubting their decision to hold, with the stock down 41% over a half decade. Unhappily, the share price slid 1.9% in the last week.
View our latest analysis for Marcus & Millichap
In his essay The Superinvestors of Graham-and-Doddsville Warren Buffett described how share prices do not always rationally reflect the value of a business. One imperfect but simple way to consider how the market perception of a company has shifted is to compare the change in the earnings per share (EPS) with the share price movement.
While the share price declined over five years, Marcus & Millichap actually managed to increase EPS by an average of 5.4% per year. Given the share price reaction, one might suspect that EPS is not a good guide to the business performance during the period (perhaps due to a one-off loss or gain). Alternatively, growth expectations may have been unreasonable in the past.
Due to the lack of correlation between the EPS growth and the falling share price, it's worth taking a look at other metrics to try to understand the share price movement.
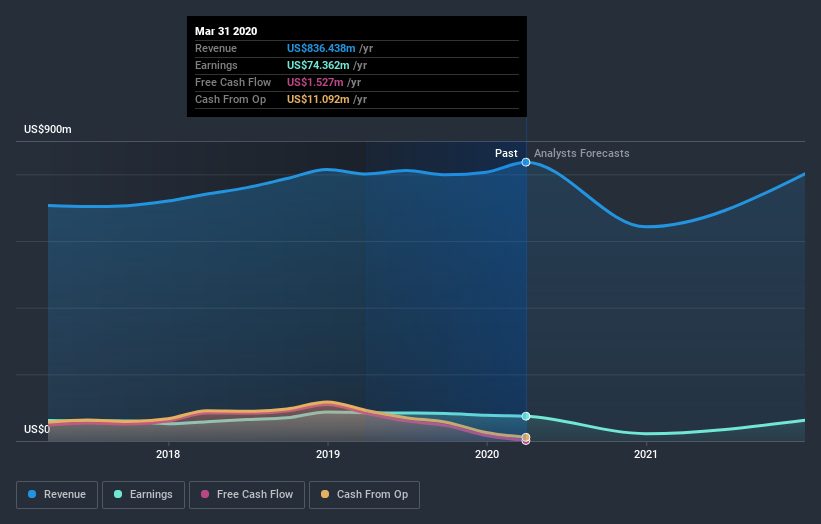
In contrast to the share price, revenue has actually increased by 5.1% a year in the five year period. So it seems one might have to take closer look at the fundamentals to understand why the share price languishes. After all, there may be an opportunity.
You can see below how earnings and revenue have changed over time (discover the exact values by clicking on the image).
You can see how its balance sheet has strengthened (or weakened) over time in this free interactive graphic.
A Different Perspective
Marcus & Millichap shareholders are down 13% for the year, but the market itself is up 9.0%. However, keep in mind that even the best stocks will sometimes underperform the market over a twelve month period. Unfortunately, last year's performance may indicate unresolved challenges, given that it was worse than the annualised loss of 10% over the last half decade. We realise that Baron Rothschild has said investors should "buy when there is blood on the streets", but we caution that investors should first be sure they are buying a high quality business. While it is well worth considering the different impacts that market conditions can have on the share price, there are other factors that are even more important. Consider for instance, the ever-present spectre of investment risk. We've identified 2 warning signs with Marcus & Millichap , and understanding them should be part of your investment process.
If you are like me, then you will not want to miss this free list of growing companies that insiders are buying.
Please note, the market returns quoted in this article reflect the market weighted average returns of stocks that currently trade on US exchanges.
This article by Simply Wall St is general in nature. It does not constitute a recommendation to buy or sell any stock, and does not take account of your objectives, or your financial situation. We aim to bring you long-term focused analysis driven by fundamental data. Note that our analysis may not factor in the latest price-sensitive company announcements or qualitative material. Simply Wall St has no position in any stocks mentioned.
Have feedback on this article? Concerned about the content? Get in touch with us directly. Alternatively, email editorial-team@simplywallst.com.
