
 Yahoo Finance
 A Look At The Intrinsic Value Of The Scotts Miracle-Gro Company (NYSE:SMG)
Key Insights
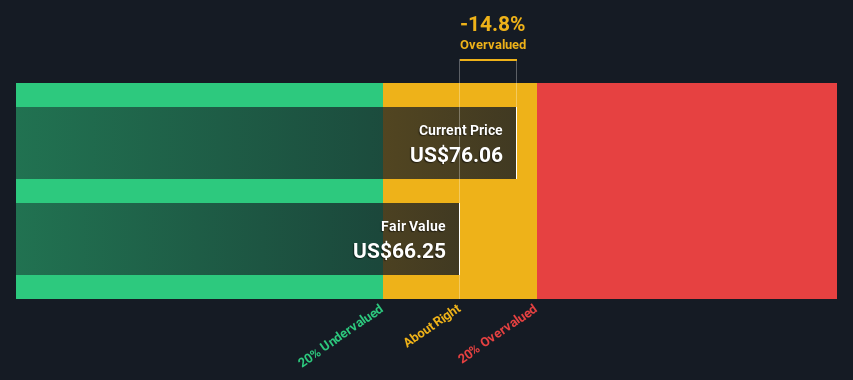
The projected fair value for Scotts Miracle-Gro is US$66.25 based on 2 Stage Free Cash Flow to Equity
With US$76.06 share price, Scotts Miracle-Gro appears to be trading close to its estimated fair value
Our fair value estimate is 16% lower than Scotts Miracle-Gro's analyst price target of US$79.14
Today we'll do a simple run through of a valuation method used to estimate the attractiveness of The Scotts Miracle-Gro Company (NYSE:SMG) as an investment opportunity by projecting its future cash flows and then discounting them to today's value. One way to achieve this is by employing the Discounted Cash Flow (DCF) model. Models like these may appear beyond the comprehension of a lay person, but they're fairly easy to follow.
Companies can be valued in a lot of ways, so we would point out that a DCF is not perfect for every situation. Anyone interested in learning a bit more about intrinsic value should have a read of the Simply Wall St analysis model.
Check out our latest analysis for Scotts Miracle-Gro
What's The Estimated Valuation?
We use what is known as a 2-stage model, which simply means we have two different periods of growth rates for the company's cash flows. Generally the first stage is higher growth, and the second stage is a lower growth phase. To begin with, we have to get estimates of the next ten years of cash flows. Where possible we use analyst estimates, but when these aren't available we extrapolate the previous free cash flow (FCF) from the last estimate or reported value. We assume companies with shrinking free cash flow will slow their rate of shrinkage, and that companies with growing free cash flow will see their growth rate slow, over this period. We do this to reflect that growth tends to slow more in the early years than it does in later years.
A DCF is all about the idea that a dollar in the future is less valuable than a dollar today, so we discount the value of these future cash flows to their estimated value in today's dollars:
10-year free cash flow (FCF) forecast
2024 | 2025 | 2026 | 2027 | 2028 | 2029 | 2030 | 2031 | 2032 | 2033 | |
Levered FCF ($, Millions) | US$550.6m | US$285.4m | US$339.0m | US$290.5m | US$263.4m | US$248.0m | US$239.6m | US$235.5m | US$234.4m | US$235.1m |
Growth Rate Estimate Source | Analyst x2 | Analyst x2 | Analyst x1 | Est @ -14.30% | Est @ -9.33% | Est @ -5.84% | Est @ -3.40% | Est @ -1.69% | Est @ -0.50% | Est @ 0.34% |
Present Value ($, Millions) Discounted @ 8.5% | US$508 | US$243 | US$266 | US$210 | US$175 | US$152 | US$136 | US$123 | US$113 | US$104 |
("Est" = FCF growth rate estimated by Simply Wall St)
Present Value of 10-year Cash Flow (PVCF) = US$2.0b
The second stage is also known as Terminal Value, this is the business's cash flow after the first stage. The Gordon Growth formula is used to calculate Terminal Value at a future annual growth rate equal to the 5-year average of the 10-year government bond yield of 2.3%. We discount the terminal cash flows to today's value at a cost of equity of 8.5%.
Terminal Value (TV)= FCF2033 × (1 + g) ÷ (r – g) = US$235m× (1 + 2.3%) ÷ (8.5%– 2.3%) = US$3.9b
Present Value of Terminal Value (PVTV)= TV / (1 + r)10= US$3.9b÷ ( 1 + 8.5%)10= US$1.7b
The total value is the sum of cash flows for the next ten years plus the discounted terminal value, which results in the Total Equity Value, which in this case is US$3.8b. To get the intrinsic value per share, we divide this by the total number of shares outstanding. Relative to the current share price of US$76.1, the company appears around fair value at the time of writing. Remember though, that this is just an approximate valuation, and like any complex formula - garbage in, garbage out.
Important Assumptions
The calculation above is very dependent on two assumptions. The first is the discount rate and the other is the cash flows. You don't have to agree with these inputs, I recommend redoing the calculations yourself and playing with them. The DCF also does not consider the possible cyclicality of an industry, or a company's future capital requirements, so it does not give a full picture of a company's potential performance. Given that we are looking at Scotts Miracle-Gro as potential shareholders, the cost of equity is used as the discount rate, rather than the cost of capital (or weighted average cost of capital, WACC) which accounts for debt. In this calculation we've used 8.5%, which is based on a levered beta of 1.343. Beta is a measure of a stock's volatility, compared to the market as a whole. We get our beta from the industry average beta of globally comparable companies, with an imposed limit between 0.8 and 2.0, which is a reasonable range for a stable business.
SWOT Analysis for Scotts Miracle-Gro
Strength
Debt is well covered by cash flow.
Weakness
Interest payments on debt are not well covered.
Dividend is low compared to the top 25% of dividend payers in the Chemicals market.
Expensive based on P/S ratio and estimated fair value.
Opportunity
Expected to breakeven next year.
Has sufficient cash runway for more than 3 years based on current free cash flows.
Threat
Total liabilities exceed total assets, which raises the risk of financial distress.
Paying a dividend but company is unprofitable.
Looking Ahead:
Valuation is only one side of the coin in terms of building your investment thesis, and it shouldn't be the only metric you look at when researching a company. DCF models are not the be-all and end-all of investment valuation. Rather it should be seen as a guide to "what assumptions need to be true for this stock to be under/overvalued?" If a company grows at a different rate, or if its cost of equity or risk free rate changes sharply, the output can look very different. For Scotts Miracle-Gro, we've compiled three essential items you should consider:
Risks: For instance, we've identified 2 warning signs for Scotts Miracle-Gro (1 is concerning) you should be aware of.
Future Earnings: How does SMG's growth rate compare to its peers and the wider market? Dig deeper into the analyst consensus number for the upcoming years by interacting with our free analyst growth expectation chart.
Other High Quality Alternatives: Do you like a good all-rounder? Explore our interactive list of high quality stocks to get an idea of what else is out there you may be missing!
PS. Simply Wall St updates its DCF calculation for every American stock every day, so if you want to find the intrinsic value of any other stock just search here.
Have feedback on this article? Concerned about the content? Get in touch with us directly. Alternatively, email editorial-team (at) simplywallst.com.
This article by Simply Wall St is general in nature. We provide commentary based on historical data and analyst forecasts only using an unbiased methodology and our articles are not intended to be financial advice. It does not constitute a recommendation to buy or sell any stock, and does not take account of your objectives, or your financial situation. We aim to bring you long-term focused analysis driven by fundamental data. Note that our analysis may not factor in the latest price-sensitive company announcements or qualitative material. Simply Wall St has no position in any stocks mentioned.
