
 Yahoo Finance
 A Look At The Intrinsic Value Of Globex Mining Enterprises Inc. (TSE:GMX)
Key Insights
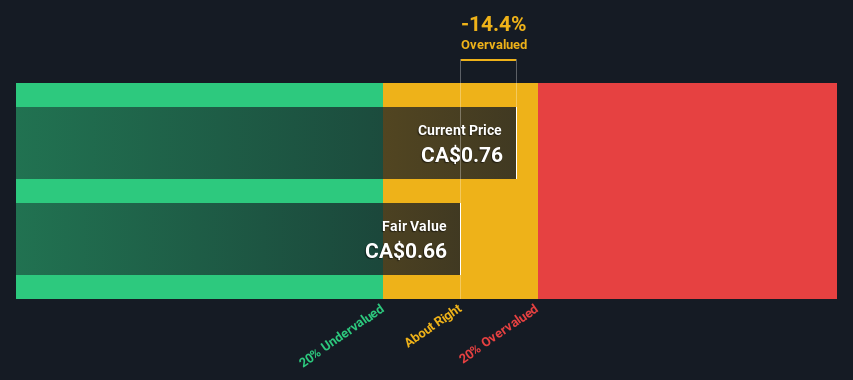
The projected fair value for Globex Mining Enterprises is CA$0.66 based on 2 Stage Free Cash Flow to Equity
Globex Mining Enterprises' CA$0.76 share price indicates it is trading at similar levels as its fair value estimate
When compared to theindustry average discount of -39%, Globex Mining Enterprises' competitors seem to be trading at a greater premium to fair value
In this article we are going to estimate the intrinsic value of Globex Mining Enterprises Inc. (TSE:GMX) by taking the forecast future cash flows of the company and discounting them back to today's value. We will use the Discounted Cash Flow (DCF) model on this occasion. Models like these may appear beyond the comprehension of a lay person, but they're fairly easy to follow.
We would caution that there are many ways of valuing a company and, like the DCF, each technique has advantages and disadvantages in certain scenarios. Anyone interested in learning a bit more about intrinsic value should have a read of the Simply Wall St analysis model.
Check out our latest analysis for Globex Mining Enterprises
What's The Estimated Valuation?
We're using the 2-stage growth model, which simply means we take in account two stages of company's growth. In the initial period the company may have a higher growth rate and the second stage is usually assumed to have a stable growth rate. To begin with, we have to get estimates of the next ten years of cash flows. Seeing as no analyst estimates of free cash flow are available to us, we have extrapolate the previous free cash flow (FCF) from the company's last reported value. We assume companies with shrinking free cash flow will slow their rate of shrinkage, and that companies with growing free cash flow will see their growth rate slow, over this period. We do this to reflect that growth tends to slow more in the early years than it does in later years.
Generally we assume that a dollar today is more valuable than a dollar in the future, so we discount the value of these future cash flows to their estimated value in today's dollars:
10-year free cash flow (FCF) forecast
2024 | 2025 | 2026 | 2027 | 2028 | 2029 | 2030 | 2031 | 2032 | 2033 | |
Levered FCF (CA$, Millions) | CA$1.87m | CA$1.97m | CA$2.05m | CA$2.13m | CA$2.19m | CA$2.25m | CA$2.31m | CA$2.36m | CA$2.41m | CA$2.46m |
Growth Rate Estimate Source | Est @ 7.01% | Est @ 5.47% | Est @ 4.38% | Est @ 3.63% | Est @ 3.10% | Est @ 2.73% | Est @ 2.47% | Est @ 2.28% | Est @ 2.16% | Est @ 2.07% |
Present Value (CA$, Millions) Discounted @ 7.4% | CA$1.7 | CA$1.7 | CA$1.7 | CA$1.6 | CA$1.5 | CA$1.5 | CA$1.4 | CA$1.3 | CA$1.3 | CA$1.2 |
("Est" = FCF growth rate estimated by Simply Wall St)
Present Value of 10-year Cash Flow (PVCF) = CA$15m
The second stage is also known as Terminal Value, this is the business's cash flow after the first stage. For a number of reasons a very conservative growth rate is used that cannot exceed that of a country's GDP growth. In this case we have used the 5-year average of the 10-year government bond yield (1.9%) to estimate future growth. In the same way as with the 10-year 'growth' period, we discount future cash flows to today's value, using a cost of equity of 7.4%.
Terminal Value (TV)= FCF2033 × (1 + g) ÷ (r – g) = CA$2.5m× (1 + 1.9%) ÷ (7.4%– 1.9%) = CA$45m
Present Value of Terminal Value (PVTV)= TV / (1 + r)10= CA$45m÷ ( 1 + 7.4%)10= CA$22m
The total value, or equity value, is then the sum of the present value of the future cash flows, which in this case is CA$37m. To get the intrinsic value per share, we divide this by the total number of shares outstanding. Relative to the current share price of CA$0.8, the company appears around fair value at the time of writing. Remember though, that this is just an approximate valuation, and like any complex formula - garbage in, garbage out.
The Assumptions
Now the most important inputs to a discounted cash flow are the discount rate, and of course, the actual cash flows. Part of investing is coming up with your own evaluation of a company's future performance, so try the calculation yourself and check your own assumptions. The DCF also does not consider the possible cyclicality of an industry, or a company's future capital requirements, so it does not give a full picture of a company's potential performance. Given that we are looking at Globex Mining Enterprises as potential shareholders, the cost of equity is used as the discount rate, rather than the cost of capital (or weighted average cost of capital, WACC) which accounts for debt. In this calculation we've used 7.4%, which is based on a levered beta of 1.116. Beta is a measure of a stock's volatility, compared to the market as a whole. We get our beta from the industry average beta of globally comparable companies, with an imposed limit between 0.8 and 2.0, which is a reasonable range for a stable business.
SWOT Analysis for Globex Mining Enterprises
Strength
Currently debt free.
Weakness
Current share price is above our estimate of fair value.
Opportunity
Has sufficient cash runway for more than 3 years based on current free cash flows.
Lack of analyst coverage makes it difficult to determine GMX's earnings prospects.
Threat
No apparent threats visible for GMX.
Looking Ahead:
Whilst important, the DCF calculation ideally won't be the sole piece of analysis you scrutinize for a company. The DCF model is not a perfect stock valuation tool. Rather it should be seen as a guide to "what assumptions need to be true for this stock to be under/overvalued?" If a company grows at a different rate, or if its cost of equity or risk free rate changes sharply, the output can look very different. For Globex Mining Enterprises, we've put together three relevant items you should further examine:
Risks: Every company has them, and we've spotted 2 warning signs for Globex Mining Enterprises you should know about.
Management:Have insiders been ramping up their shares to take advantage of the market's sentiment for GMX's future outlook? Check out our management and board analysis with insights on CEO compensation and governance factors.
Other High Quality Alternatives: Do you like a good all-rounder? Explore our interactive list of high quality stocks to get an idea of what else is out there you may be missing!
PS. Simply Wall St updates its DCF calculation for every Canadian stock every day, so if you want to find the intrinsic value of any other stock just search here.
Have feedback on this article? Concerned about the content? Get in touch with us directly. Alternatively, email editorial-team (at) simplywallst.com.
This article by Simply Wall St is general in nature. We provide commentary based on historical data and analyst forecasts only using an unbiased methodology and our articles are not intended to be financial advice. It does not constitute a recommendation to buy or sell any stock, and does not take account of your objectives, or your financial situation. We aim to bring you long-term focused analysis driven by fundamental data. Note that our analysis may not factor in the latest price-sensitive company announcements or qualitative material. Simply Wall St has no position in any stocks mentioned.
