
 Yahoo Finance
 A Look At The Fair Value Of GDI Integrated Facility Services Inc. (TSE:GDI)
Key Insights
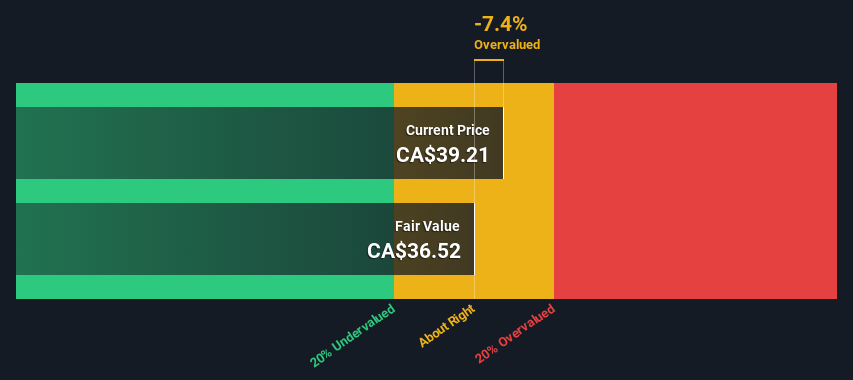
Using the 2 Stage Free Cash Flow to Equity, GDI Integrated Facility Services fair value estimate is CA$36.52
Current share price of CA$39.21 suggests GDI Integrated Facility Services is potentially trading close to its fair value
The CA$42.83 analyst price target for GDI is 17% more than our estimate of fair value
Today we will run through one way of estimating the intrinsic value of GDI Integrated Facility Services Inc. (TSE:GDI) by taking the expected future cash flows and discounting them to their present value. One way to achieve this is by employing the Discounted Cash Flow (DCF) model. Before you think you won't be able to understand it, just read on! It's actually much less complex than you'd imagine.
Companies can be valued in a lot of ways, so we would point out that a DCF is not perfect for every situation. If you still have some burning questions about this type of valuation, take a look at the Simply Wall St analysis model.
See our latest analysis for GDI Integrated Facility Services
Is GDI Integrated Facility Services Fairly Valued?
We're using the 2-stage growth model, which simply means we take in account two stages of company's growth. In the initial period the company may have a higher growth rate and the second stage is usually assumed to have a stable growth rate. In the first stage we need to estimate the cash flows to the business over the next ten years. Where possible we use analyst estimates, but when these aren't available we extrapolate the previous free cash flow (FCF) from the last estimate or reported value. We assume companies with shrinking free cash flow will slow their rate of shrinkage, and that companies with growing free cash flow will see their growth rate slow, over this period. We do this to reflect that growth tends to slow more in the early years than it does in later years.
Generally we assume that a dollar today is more valuable than a dollar in the future, so we need to discount the sum of these future cash flows to arrive at a present value estimate:
10-year free cash flow (FCF) forecast
2024 | 2025 | 2026 | 2027 | 2028 | 2029 | 2030 | 2031 | 2032 | 2033 | |
Levered FCF (CA$, Millions) | CA$79.1m | CA$63.8m | CA$55.3m | CA$50.5m | CA$47.8m | CA$46.2m | CA$45.5m | CA$45.2m | CA$45.3m | CA$45.6m |
Growth Rate Estimate Source | Analyst x4 | Analyst x3 | Est @ -13.23% | Est @ -8.67% | Est @ -5.47% | Est @ -3.23% | Est @ -1.67% | Est @ -0.57% | Est @ 0.20% | Est @ 0.74% |
Present Value (CA$, Millions) Discounted @ 7.0% | CA$73.9 | CA$55.7 | CA$45.2 | CA$38.6 | CA$34.1 | CA$30.8 | CA$28.3 | CA$26.3 | CA$24.7 | CA$23.2 |
("Est" = FCF growth rate estimated by Simply Wall St)
Present Value of 10-year Cash Flow (PVCF) = CA$381m
After calculating the present value of future cash flows in the initial 10-year period, we need to calculate the Terminal Value, which accounts for all future cash flows beyond the first stage. The Gordon Growth formula is used to calculate Terminal Value at a future annual growth rate equal to the 5-year average of the 10-year government bond yield of 2.0%. We discount the terminal cash flows to today's value at a cost of equity of 7.0%.
Terminal Value (TV)= FCF2033 × (1 + g) ÷ (r – g) = CA$46m× (1 + 2.0%) ÷ (7.0%– 2.0%) = CA$933m
Present Value of Terminal Value (PVTV)= TV / (1 + r)10= CA$933m÷ ( 1 + 7.0%)10= CA$475m
The total value is the sum of cash flows for the next ten years plus the discounted terminal value, which results in the Total Equity Value, which in this case is CA$856m. To get the intrinsic value per share, we divide this by the total number of shares outstanding. Compared to the current share price of CA$39.2, the company appears around fair value at the time of writing. The assumptions in any calculation have a big impact on the valuation, so it is better to view this as a rough estimate, not precise down to the last cent.
The Assumptions
We would point out that the most important inputs to a discounted cash flow are the discount rate and of course the actual cash flows. If you don't agree with these result, have a go at the calculation yourself and play with the assumptions. The DCF also does not consider the possible cyclicality of an industry, or a company's future capital requirements, so it does not give a full picture of a company's potential performance. Given that we are looking at GDI Integrated Facility Services as potential shareholders, the cost of equity is used as the discount rate, rather than the cost of capital (or weighted average cost of capital, WACC) which accounts for debt. In this calculation we've used 7.0%, which is based on a levered beta of 1.084. Beta is a measure of a stock's volatility, compared to the market as a whole. We get our beta from the industry average beta of globally comparable companies, with an imposed limit between 0.8 and 2.0, which is a reasonable range for a stable business.
SWOT Analysis for GDI Integrated Facility Services
Strength
No major strengths identified for GDI.
Weakness
Earnings declined over the past year.
Interest payments on debt are not well covered.
Expensive based on P/E ratio and estimated fair value.
Opportunity
Annual earnings are forecast to grow faster than the Canadian market.
Threat
Debt is not well covered by operating cash flow.
Annual revenue is forecast to grow slower than the Canadian market.
Moving On:
Valuation is only one side of the coin in terms of building your investment thesis, and it ideally won't be the sole piece of analysis you scrutinize for a company. DCF models are not the be-all and end-all of investment valuation. Rather it should be seen as a guide to "what assumptions need to be true for this stock to be under/overvalued?" For instance, if the terminal value growth rate is adjusted slightly, it can dramatically alter the overall result. For GDI Integrated Facility Services, we've compiled three additional elements you should further examine:
Risks: Every company has them, and we've spotted 2 warning signs for GDI Integrated Facility Services (of which 1 makes us a bit uncomfortable!) you should know about.
Future Earnings: How does GDI's growth rate compare to its peers and the wider market? Dig deeper into the analyst consensus number for the upcoming years by interacting with our free analyst growth expectation chart.
Other High Quality Alternatives: Do you like a good all-rounder? Explore our interactive list of high quality stocks to get an idea of what else is out there you may be missing!
PS. Simply Wall St updates its DCF calculation for every Canadian stock every day, so if you want to find the intrinsic value of any other stock just search here.
Have feedback on this article? Concerned about the content? Get in touch with us directly. Alternatively, email editorial-team (at) simplywallst.com.
This article by Simply Wall St is general in nature. We provide commentary based on historical data and analyst forecasts only using an unbiased methodology and our articles are not intended to be financial advice. It does not constitute a recommendation to buy or sell any stock, and does not take account of your objectives, or your financial situation. We aim to bring you long-term focused analysis driven by fundamental data. Note that our analysis may not factor in the latest price-sensitive company announcements or qualitative material. Simply Wall St has no position in any stocks mentioned.
