
 Yahoo Finance
 A Look At 3M's (NYSE:MMM) Share Price Returns
For many investors, the main point of stock picking is to generate higher returns than the overall market. But in any portfolio, there are likely to be some stocks that fall short of that benchmark. Unfortunately, that's been the case for longer term 3M Company (NYSE:MMM) shareholders, since the share price is down 30% in the last three years, falling well short of the market return of around 48%. There was little comfort for shareholders in the last week as the price declined a further 2.9%.
Check out our latest analysis for 3M
There is no denying that markets are sometimes efficient, but prices do not always reflect underlying business performance. One imperfect but simple way to consider how the market perception of a company has shifted is to compare the change in the earnings per share (EPS) with the share price movement.
During the three years that the share price fell, 3M's earnings per share (EPS) dropped by 2.1% each year. The share price decline of 11% is actually steeper than the EPS slippage. So it seems the market was too confident about the business, in the past.
You can see how EPS has changed over time in the image below (click on the chart to see the exact values).
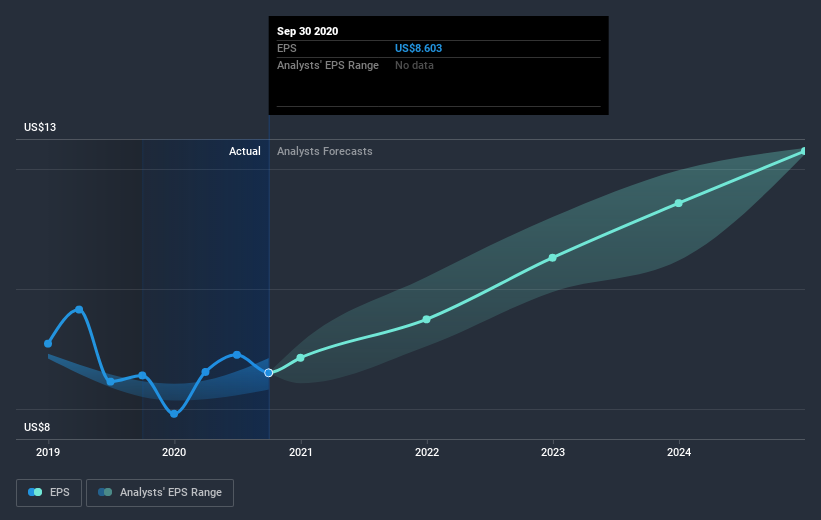
It might be well worthwhile taking a look at our free report on 3M's earnings, revenue and cash flow.
What About Dividends?
When looking at investment returns, it is important to consider the difference between total shareholder return (TSR) and share price return. The TSR incorporates the value of any spin-offs or discounted capital raisings, along with any dividends, based on the assumption that the dividends are reinvested. So for companies that pay a generous dividend, the TSR is often a lot higher than the share price return. As it happens, 3M's TSR for the last 3 years was -23%, which exceeds the share price return mentioned earlier. The dividends paid by the company have thusly boosted the total shareholder return.
A Different Perspective
Investors in 3M had a tough year, with a total loss of 2.8% (including dividends), against a market gain of about 25%. Even the share prices of good stocks drop sometimes, but we want to see improvements in the fundamental metrics of a business, before getting too interested. On the bright side, long term shareholders have made money, with a gain of 7% per year over half a decade. If the fundamental data continues to indicate long term sustainable growth, the current sell-off could be an opportunity worth considering. It's always interesting to track share price performance over the longer term. But to understand 3M better, we need to consider many other factors. Take risks, for example - 3M has 2 warning signs we think you should be aware of.
Of course 3M may not be the best stock to buy. So you may wish to see this free collection of growth stocks.
Please note, the market returns quoted in this article reflect the market weighted average returns of stocks that currently trade on US exchanges.
This article by Simply Wall St is general in nature. It does not constitute a recommendation to buy or sell any stock, and does not take account of your objectives, or your financial situation. We aim to bring you long-term focused analysis driven by fundamental data. Note that our analysis may not factor in the latest price-sensitive company announcements or qualitative material. Simply Wall St has no position in any stocks mentioned.
Have feedback on this article? Concerned about the content? Get in touch with us directly. Alternatively, email editorial-team (at) simplywallst.com.
