
 Yahoo Finance
 Lockheed Martin's (NYSE:LMT) Returns Have Hit A Wall
There are a few key trends to look for if we want to identify the next multi-bagger. Typically, we'll want to notice a trend of growing return on capital employed (ROCE) and alongside that, an expanding base of capital employed. Basically this means that a company has profitable initiatives that it can continue to reinvest in, which is a trait of a compounding machine. So when we looked at Lockheed Martin (NYSE:LMT), they do have a high ROCE, but we weren't exactly elated from how returns are trending.
Return On Capital Employed (ROCE): What Is It?
For those that aren't sure what ROCE is, it measures the amount of pre-tax profits a company can generate from the capital employed in its business. The formula for this calculation on Lockheed Martin is:
Return on Capital Employed = Earnings Before Interest and Tax (EBIT) ÷ (Total Assets - Current Liabilities)
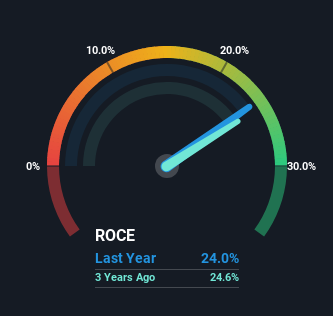
0.24 = US$9.0b ÷ (US$55b - US$18b) (Based on the trailing twelve months to March 2024).
Thus, Lockheed Martin has an ROCE of 24%. In absolute terms that's a great return and it's even better than the Aerospace & Defense industry average of 9.8%.
View our latest analysis for Lockheed Martin
In the above chart we have measured Lockheed Martin's prior ROCE against its prior performance, but the future is arguably more important. If you'd like to see what analysts are forecasting going forward, you should check out our free analyst report for Lockheed Martin .
What Does the ROCE Trend For Lockheed Martin Tell Us?
There hasn't been much to report for Lockheed Martin's returns and its level of capital employed because both metrics have been steady for the past five years. It's not uncommon to see this when looking at a mature and stable business that isn't re-investing its earnings because it has likely passed that phase of the business cycle. Although current returns are high, we'd need more evidence of underlying growth for it to look like a multi-bagger going forward. With fewer investment opportunities, it makes sense that Lockheed Martin has been paying out a decent 49% of its earnings to shareholders. Given the business isn't reinvesting in itself, it makes sense to distribute a portion of earnings among shareholders.
The Key Takeaway
Although is allocating it's capital efficiently to generate impressive returns, it isn't compounding its base of capital, which is what we'd see from a multi-bagger. Although the market must be expecting these trends to improve because the stock has gained 56% over the last five years. Ultimately, if the underlying trends persist, we wouldn't hold our breath on it being a multi-bagger going forward.
On a final note, we've found 2 warning signs for Lockheed Martin that we think you should be aware of.
High returns are a key ingredient to strong performance, so check out our free list ofstocks earning high returns on equity with solid balance sheets.
Have feedback on this article? Concerned about the content? Get in touch with us directly. Alternatively, email editorial-team (at) simplywallst.com.
This article by Simply Wall St is general in nature. We provide commentary based on historical data and analyst forecasts only using an unbiased methodology and our articles are not intended to be financial advice. It does not constitute a recommendation to buy or sell any stock, and does not take account of your objectives, or your financial situation. We aim to bring you long-term focused analysis driven by fundamental data. Note that our analysis may not factor in the latest price-sensitive company announcements or qualitative material. Simply Wall St has no position in any stocks mentioned.
