
 Yahoo Finance
 Lockheed Martin (NYSE:LMT) Hasn't Managed To Accelerate Its Returns
To find a multi-bagger stock, what are the underlying trends we should look for in a business? Amongst other things, we'll want to see two things; firstly, a growing return on capital employed (ROCE) and secondly, an expansion in the company's amount of capital employed. Basically this means that a company has profitable initiatives that it can continue to reinvest in, which is a trait of a compounding machine. Having said that, while the ROCE is currently high for Lockheed Martin (NYSE:LMT), we aren't jumping out of our chairs because returns are decreasing.
Understanding Return On Capital Employed (ROCE)
Just to clarify if you're unsure, ROCE is a metric for evaluating how much pre-tax income (in percentage terms) a company earns on the capital invested in its business. To calculate this metric for Lockheed Martin, this is the formula:
Return on Capital Employed = Earnings Before Interest and Tax (EBIT) ÷ (Total Assets - Current Liabilities)
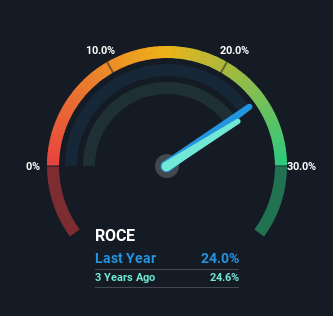
0.24 = US$9.0b ÷ (US$55b - US$18b) (Based on the trailing twelve months to March 2024).
Therefore, Lockheed Martin has an ROCE of 24%. In absolute terms that's a great return and it's even better than the Aerospace & Defense industry average of 9.8%.
See our latest analysis for Lockheed Martin
In the above chart we have measured Lockheed Martin's prior ROCE against its prior performance, but the future is arguably more important. If you're interested, you can view the analysts predictions in our free analyst report for Lockheed Martin .
What Does the ROCE Trend For Lockheed Martin Tell Us?
Over the past five years, Lockheed Martin's ROCE and capital employed have both remained mostly flat. It's not uncommon to see this when looking at a mature and stable business that isn't re-investing its earnings because it has likely passed that phase of the business cycle. So while the current operations are delivering respectable returns, unless capital employed increases we'd be hard-pressed to believe it's a multi-bagger going forward. With fewer investment opportunities, it makes sense that Lockheed Martin has been paying out a decent 48% of its earnings to shareholders. Given the business isn't reinvesting in itself, it makes sense to distribute a portion of earnings among shareholders.
The Bottom Line
While Lockheed Martin has impressive profitability from its capital, it isn't increasing that amount of capital. Since the stock has gained an impressive 46% over the last five years, investors must think there's better things to come. But if the trajectory of these underlying trends continue, we think the likelihood of it being a multi-bagger from here isn't high.
One more thing, we've spotted 1 warning sign facing Lockheed Martin that you might find interesting.
If you want to search for more stocks that have been earning high returns, check out this free list of stocks with solid balance sheets that are also earning high returns on equity.
Have feedback on this article? Concerned about the content? Get in touch with us directly. Alternatively, email editorial-team (at) simplywallst.com.
This article by Simply Wall St is general in nature. We provide commentary based on historical data and analyst forecasts only using an unbiased methodology and our articles are not intended to be financial advice. It does not constitute a recommendation to buy or sell any stock, and does not take account of your objectives, or your financial situation. We aim to bring you long-term focused analysis driven by fundamental data. Note that our analysis may not factor in the latest price-sensitive company announcements or qualitative material. Simply Wall St has no position in any stocks mentioned.
Have feedback on this article? Concerned about the content? Get in touch with us directly. Alternatively, email editorial-team@simplywallst.com
