
 Yahoo Finance
 LiveRamp Holdings, Inc. (NYSE:RAMP): Financial Strength Analysis

Want to participate in a short research study? Help shape the future of investing tools and you could win a $250 gift card!
Stocks with market capitalization between $2B and $10B, such as LiveRamp Holdings, Inc. (NYSE:RAMP) with a size of US$3.3b, do not attract as much attention from the investing community as do the small-caps and large-caps. While they are less talked about as an investment category, mid-cap risk-adjusted returns have generally been better than more commonly focused stocks that fall into the small- or large-cap categories. RAMP’s financial liquidity and debt position will be analysed in this article, to get an idea of whether the company can fund opportunities for strategic growth and maintain strength through economic downturns. Note that this commentary is very high-level and solely focused on financial health, so I suggest you dig deeper yourself into RAMP here.
Check out our latest analysis for LiveRamp Holdings
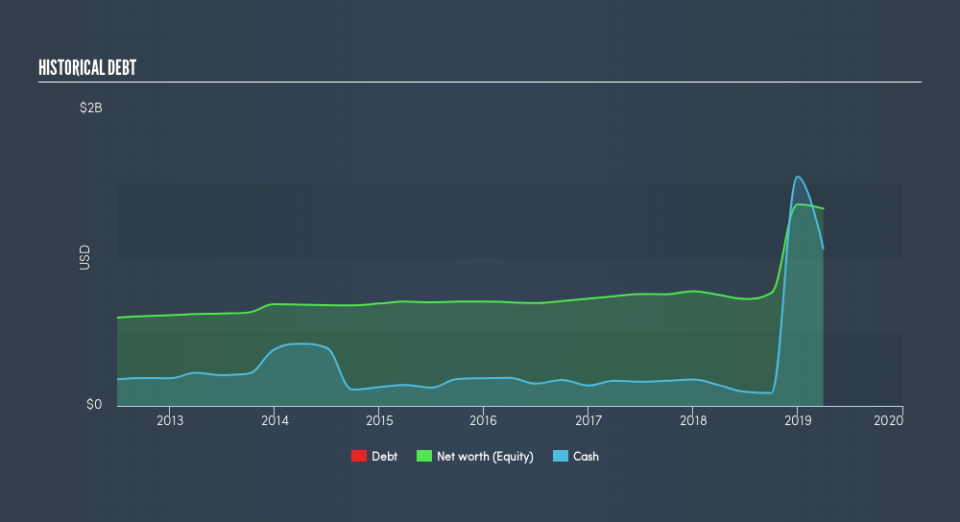
Does RAMP face the risk of succumbing to its debt-load?
Debt-to-equity ratio standards differ between industries, as some are more capital-intensive than others, meaning they need more capital to carry out core operations. As a rule of thumb, a financially healthy mid-cap should have a ratio less than 40%. For RAMP, the debt-to-equity ratio is zero, meaning that the company has no debt. This means it has been running its business utilising funding from only its equity capital, which is rather impressive. Investors' risk associated with debt is virtually non-existent with RAMP, and the company has plenty of headroom and ability to raise debt should it need to in the future.
Does RAMP’s liquid assets cover its short-term commitments?
Given zero long-term debt on its balance sheet, LiveRamp Holdings has no solvency issues, which is used to describe the company’s ability to meet its long-term obligations. However, another measure of financial health is its short-term obligations, which is known as liquidity. These include payments to suppliers, employees and other stakeholders. At the current liabilities level of US$95m, the company has maintained a safe level of current assets to meet its obligations, with the current ratio last standing at 12.53x. The current ratio is calculated by dividing current assets by current liabilities. However, many consider a ratio above 3x to be high.
Next Steps:
RAMP has no debt in addition to ample cash to cover its short-term liabilities. Its safe operations reduces risk for the company and shareholders, but some level of debt could also boost earnings growth and operational efficiency. Keep in mind I haven't considered other factors such as how RAMP has performed in the past. I recommend you continue to research LiveRamp Holdings to get a better picture of the stock by looking at:
Future Outlook: What are well-informed industry analysts predicting for RAMP’s future growth? Take a look at our free research report of analyst consensus for RAMP’s outlook.
Valuation: What is RAMP worth today? Is the stock undervalued, even when its growth outlook is factored into its intrinsic value? The intrinsic value infographic in our free research report helps visualize whether RAMP is currently mispriced by the market.
Other High-Performing Stocks: Are there other stocks that provide better prospects with proven track records? Explore our free list of these great stocks here.
We aim to bring you long-term focused research analysis driven by fundamental data. Note that our analysis may not factor in the latest price-sensitive company announcements or qualitative material.
If you spot an error that warrants correction, please contact the editor at editorial-team@simplywallst.com. This article by Simply Wall St is general in nature. It does not constitute a recommendation to buy or sell any stock, and does not take account of your objectives, or your financial situation. Simply Wall St has no position in the stocks mentioned. Thank you for reading.
