
 Yahoo Finance
 Live Ventures (NASDAQ:LIVE) shareholders have earned a 71% CAGR over the last three years
It hasn't been the best quarter for Live Ventures Incorporated (NASDAQ:LIVE) shareholders, since the share price has fallen 14% in that time. But that doesn't change the fact that the returns over the last three years have been spectacular. The longer term view reveals that the share price is up 402% in that period. So you might argue that the recent reduction in the share price is unremarkable in light of the longer term performance. Only time will tell if there is still too much optimism currently reflected in the share price.
Let's take a look at the underlying fundamentals over the longer term, and see if they've been consistent with shareholders returns.
See our latest analysis for Live Ventures
To paraphrase Benjamin Graham: Over the short term the market is a voting machine, but over the long term it's a weighing machine. One imperfect but simple way to consider how the market perception of a company has shifted is to compare the change in the earnings per share (EPS) with the share price movement.
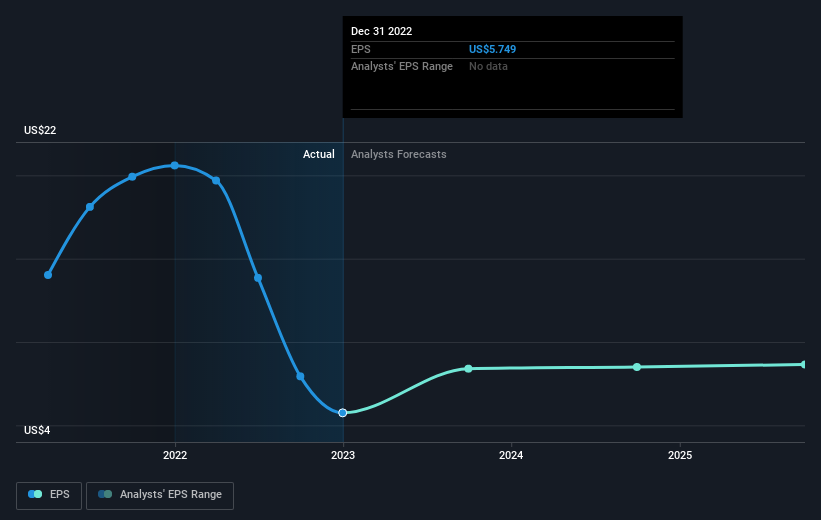
During three years of share price growth, Live Ventures moved from a loss to profitability. Given the importance of this milestone, it's not overly surprising that the share price has increased strongly.
The company's earnings per share (over time) is depicted in the image below (click to see the exact numbers).
It's probably worth noting that the CEO is paid less than the median at similar sized companies. But while CEO remuneration is always worth checking, the really important question is whether the company can grow earnings going forward. Before buying or selling a stock, we always recommend a close examination of historic growth trends, available here..
A Different Perspective
We regret to report that Live Ventures shareholders are down 20% for the year. Unfortunately, that's worse than the broader market decline of 7.7%. Having said that, it's inevitable that some stocks will be oversold in a falling market. The key is to keep your eyes on the fundamental developments. On the bright side, long term shareholders have made money, with a gain of 19% per year over half a decade. It could be that the recent sell-off is an opportunity, so it may be worth checking the fundamental data for signs of a long term growth trend. It's always interesting to track share price performance over the longer term. But to understand Live Ventures better, we need to consider many other factors. Even so, be aware that Live Ventures is showing 4 warning signs in our investment analysis , and 2 of those are a bit unpleasant...
But note: Live Ventures may not be the best stock to buy. So take a peek at this free list of interesting companies with past earnings growth (and further growth forecast).
Please note, the market returns quoted in this article reflect the market weighted average returns of stocks that currently trade on American exchanges.
Have feedback on this article? Concerned about the content? Get in touch with us directly. Alternatively, email editorial-team (at) simplywallst.com.
This article by Simply Wall St is general in nature. We provide commentary based on historical data and analyst forecasts only using an unbiased methodology and our articles are not intended to be financial advice. It does not constitute a recommendation to buy or sell any stock, and does not take account of your objectives, or your financial situation. We aim to bring you long-term focused analysis driven by fundamental data. Note that our analysis may not factor in the latest price-sensitive company announcements or qualitative material. Simply Wall St has no position in any stocks mentioned.
Join A Paid User Research Session
You’ll receive a US$30 Amazon Gift card for 1 hour of your time while helping us build better investing tools for the individual investors like yourself. Sign up here
