
 Yahoo Finance
 Little Excitement Around Plurilock Security Inc.'s (CVE:PLUR) Revenues
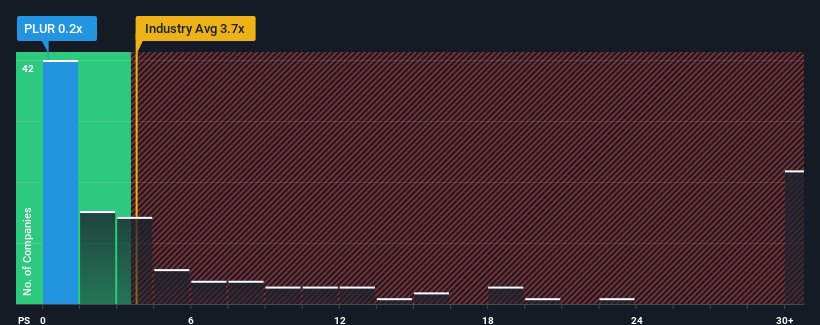
You may think that with a price-to-sales (or "P/S") ratio of 0.2x Plurilock Security Inc. (CVE:PLUR) is definitely a stock worth checking out, seeing as almost half of all the Software companies in Canada have P/S ratios greater than 3.7x and even P/S above 13x aren't out of the ordinary. Nonetheless, we'd need to dig a little deeper to determine if there is a rational basis for the highly reduced P/S.
Check out our latest analysis for Plurilock Security
What Does Plurilock Security's Recent Performance Look Like?
Recent times have been advantageous for Plurilock Security as its revenues have been rising faster than most other companies. One possibility is that the P/S ratio is low because investors think this strong revenue performance might be less impressive moving forward. If not, then existing shareholders have reason to be quite optimistic about the future direction of the share price.
Want the full picture on analyst estimates for the company? Then our free report on Plurilock Security will help you uncover what's on the horizon.
What Are Revenue Growth Metrics Telling Us About The Low P/S?
There's an inherent assumption that a company should far underperform the industry for P/S ratios like Plurilock Security's to be considered reasonable.
Retrospectively, the last year delivered an exceptional 69% gain to the company's top line. This great performance means it was also able to deliver immense revenue growth over the last three years. Therefore, it's fair to say the revenue growth recently has been superb for the company.
Turning to the outlook, the next year should generate growth of 15% as estimated by the two analysts watching the company. That's shaping up to be materially lower than the 18% growth forecast for the broader industry.
With this information, we can see why Plurilock Security is trading at a P/S lower than the industry. Apparently many shareholders weren't comfortable holding on while the company is potentially eyeing a less prosperous future.
The Key Takeaway
Using the price-to-sales ratio alone to determine if you should sell your stock isn't sensible, however it can be a practical guide to the company's future prospects.
As we suspected, our examination of Plurilock Security's analyst forecasts revealed that its inferior revenue outlook is contributing to its low P/S. At this stage investors feel the potential for an improvement in revenue isn't great enough to justify a higher P/S ratio. The company will need a change of fortune to justify the P/S rising higher in the future.
Having said that, be aware Plurilock Security is showing 3 warning signs in our investment analysis, and 1 of those shouldn't be ignored.
It's important to make sure you look for a great company, not just the first idea you come across. So if growing profitability aligns with your idea of a great company, take a peek at this free list of interesting companies with strong recent earnings growth (and a low P/E).
Have feedback on this article? Concerned about the content? Get in touch with us directly. Alternatively, email editorial-team (at) simplywallst.com.
This article by Simply Wall St is general in nature. We provide commentary based on historical data and analyst forecasts only using an unbiased methodology and our articles are not intended to be financial advice. It does not constitute a recommendation to buy or sell any stock, and does not take account of your objectives, or your financial situation. We aim to bring you long-term focused analysis driven by fundamental data. Note that our analysis may not factor in the latest price-sensitive company announcements or qualitative material. Simply Wall St has no position in any stocks mentioned.
Join A Paid User Research Session
You’ll receive a US$30 Amazon Gift card for 1 hour of your time while helping us build better investing tools for the individual investors like yourself. Sign up here
