
 Yahoo Finance
 Little Excitement Around Pharos Energy plc's (LON:PHAR) Earnings
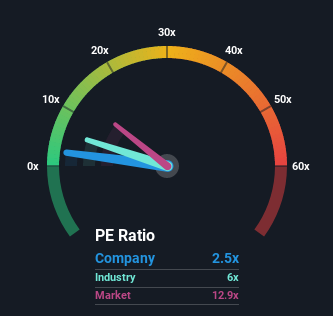
With a price-to-earnings (or "P/E") ratio of 2.5x Pharos Energy plc (LON:PHAR) may be sending very bullish signals at the moment, given that almost half of all companies in the United Kingdom have P/E ratios greater than 13x and even P/E's higher than 26x are not unusual. Although, it's not wise to just take the P/E at face value as there may be an explanation why it's so limited.
Pharos Energy could be doing better as its earnings have been going backwards lately while most other companies have been seeing positive earnings growth. It seems that many are expecting the dour earnings performance to persist, which has repressed the P/E. If this is the case, then existing shareholders will probably struggle to get excited about the future direction of the share price.
View our latest analysis for Pharos Energy
Keen to find out how analysts think Pharos Energy's future stacks up against the industry? In that case, our free report is a great place to start.
What Are Growth Metrics Telling Us About The Low P/E?
The only time you'd be truly comfortable seeing a P/E as depressed as Pharos Energy's is when the company's growth is on track to lag the market decidedly.
If we review the last year of earnings, dishearteningly the company's profits fell to the tune of 30%. Unfortunately, that's brought it right back to where it started three years ago with EPS growth being virtually non-existent overall during that time. So it appears to us that the company has had a mixed result in terms of growing earnings over that time.
Shifting to the future, estimates from the three analysts covering the company suggest earnings growth is heading into negative territory, declining 84% per annum over the next three years. Meanwhile, the broader market is forecast to expand by 10% per annum, which paints a poor picture.
With this information, we are not surprised that Pharos Energy is trading at a P/E lower than the market. Nonetheless, there's no guarantee the P/E has reached a floor yet with earnings going in reverse. There's potential for the P/E to fall to even lower levels if the company doesn't improve its profitability.
The Final Word
Using the price-to-earnings ratio alone to determine if you should sell your stock isn't sensible, however it can be a practical guide to the company's future prospects.
As we suspected, our examination of Pharos Energy's analyst forecasts revealed that its outlook for shrinking earnings is contributing to its low P/E. Right now shareholders are accepting the low P/E as they concede future earnings probably won't provide any pleasant surprises. Unless these conditions improve, they will continue to form a barrier for the share price around these levels.
You should always think about risks. Case in point, we've spotted 2 warning signs for Pharos Energy you should be aware of, and 1 of them is concerning.
It's important to make sure you look for a great company, not just the first idea you come across. So take a peek at this free list of interesting companies with strong recent earnings growth (and a P/E ratio below 20x).
Have feedback on this article? Concerned about the content? Get in touch with us directly. Alternatively, email editorial-team (at) simplywallst.com.
This article by Simply Wall St is general in nature. We provide commentary based on historical data and analyst forecasts only using an unbiased methodology and our articles are not intended to be financial advice. It does not constitute a recommendation to buy or sell any stock, and does not take account of your objectives, or your financial situation. We aim to bring you long-term focused analysis driven by fundamental data. Note that our analysis may not factor in the latest price-sensitive company announcements or qualitative material. Simply Wall St has no position in any stocks mentioned.
Join A Paid User Research Session
You’ll receive a US$30 Amazon Gift card for 1 hour of your time while helping us build better investing tools for the individual investors like yourself. Sign up here
