Litecoin, Stellar’s Lumen, and Tron’s TRX – Daily Analysis – 21/04/20
Litecoin
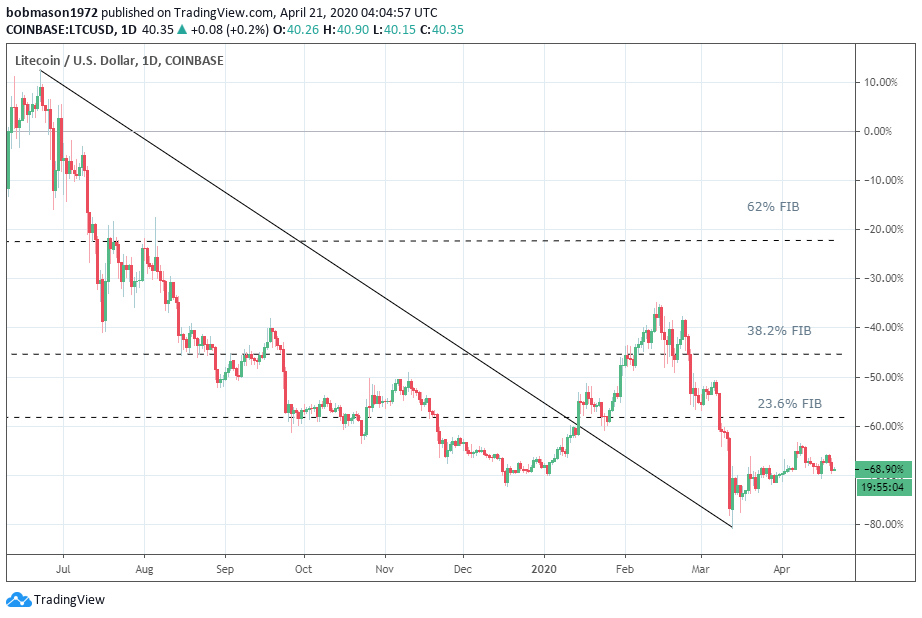
Litecoin slid by 4.80% on Monday. Following on from a 4.39% slide on Sunday, Litecoin ended the day at $40.27.
A bullish start to the day saw Litecoin rise to an early morning intraday high $43.33 before hitting reverse.
Falling short of the first major resistance level at $43.93, Litecoin tumbled to a late intraday low $39.53.
Litecoin fell through the first major support level at $41.10 and the second major support level at $39.91.
Finding late support from the broader market, Litecoin broke back through the second major support level to wrap up the day at $40 levels.
At the time of writing, Litecoin was up by 0.20% to $40.35. A mixed start to the day saw Litecoin rise from an early morning low $40.15 to a high $40.90.
Litecoin left the major support and resistance levels untested early on.

For the day ahead
Litecoin would need to move back through to $41 levels to support a run at the first major resistance level at $42.56.
Support from the broader market would be needed, however, for Litecoin to breakout out from the morning high $40.90.
Barring an extended crypto rally, resistance at $41 would likely leave Litecoin short of the first major resistance level at $42.56.
Failure to move through to $41 levels could see Litecoin struggle later in the day.
A fall through the morning low $40.15 would bring the first major support level at $38.76 into play.
Barring a broad-based crypto sell-off, however, Litecoin should steer clear of sub-$39 levels.
Looking at the Technical Indicators
Major Support Level: $38.76
Major Resistance Level: $42.56
23.6% FIB Retracement Level: $62
38.2% FIB Retracement Level: $78
62% FIB Retracement Level: $104
Stellar’s Lumen
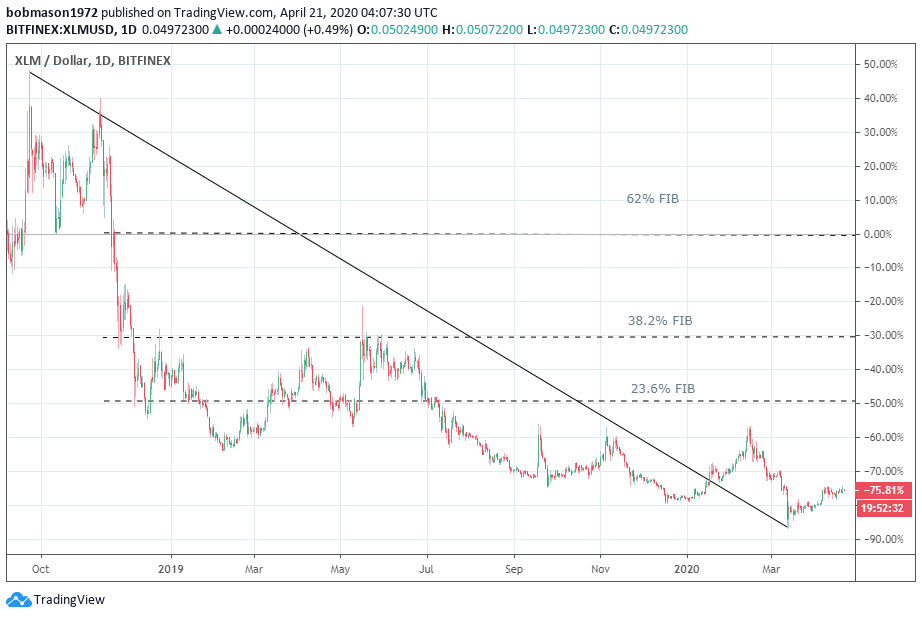
Stellar’s Lumen rose by 0.94% on Monday. Reversing a 3.28% fall from Sunday, Stellar’s Lumen ended the day at $0.049483.
A bullish start to the day saw Stellar’s Lumen rise to a mid-morning high $0.052323 before falling back to $0.050 levels.
Stellar’s Lumen broke through the first major resistance level at $0.05025 and the second major resistance level at $0.05148.
Recovering from $0.50 levels, Stellar’s Lumen rallied to a late afternoon intraday high $0.053109 before sliding back.
Stellar’s Lumen broke through the second major resistance level at $0.05148 before tumbling to a late intraday low $0.048749.
While falling back through the major resistance levels, Stellar’s Lumen steered clear of the first major support level at $0.04822.
Finding late support, Stellar’s Lumen broke back through the first major resistance level before easing back to sub-$0.050.
At the time of writing, Stellar’s Lumen was up by 0.49% to $0.049723. A mixed start to the day saw Stellar’s Lumen rise to an early morning high $0.050722 before falling back to a low $0.049723.
Stellar’s Lumen left the major support and resistance levels untested early on.

For the day ahead
Stellar’s Lumen would need to move back through to $0.050 levels to support a run at the first major resistance level at $0.05162.
Support from the broader market would be needed, however, for Stellar’s Lumen to breakout from the morning high $0.050722.
Barring a broad-based crypto rebound, resistance at $0.051 would likely leave Stellar’s Lumen short of the first major resistance level.
Failure to move through to $0.050 levels could see Stellar’s Lumen hit reverse.
A fall through to sub-$0.04950 levels would bring the first major support level at $0.04805 into play.
Barring an extended crypto sell-off, however, Stellar’s Lumen should steer clear of sub-$0.048 support levels.
Looking at the Technical Indicators
Major Support Level: $0.04805
Major Resistance Level: $0.05162
23.6% FIB Retracement Level: $0.1051
38% FIB Retracement Level: $0.1433
62% FIB Retracement Level: $0.2050
Tron’s TRX
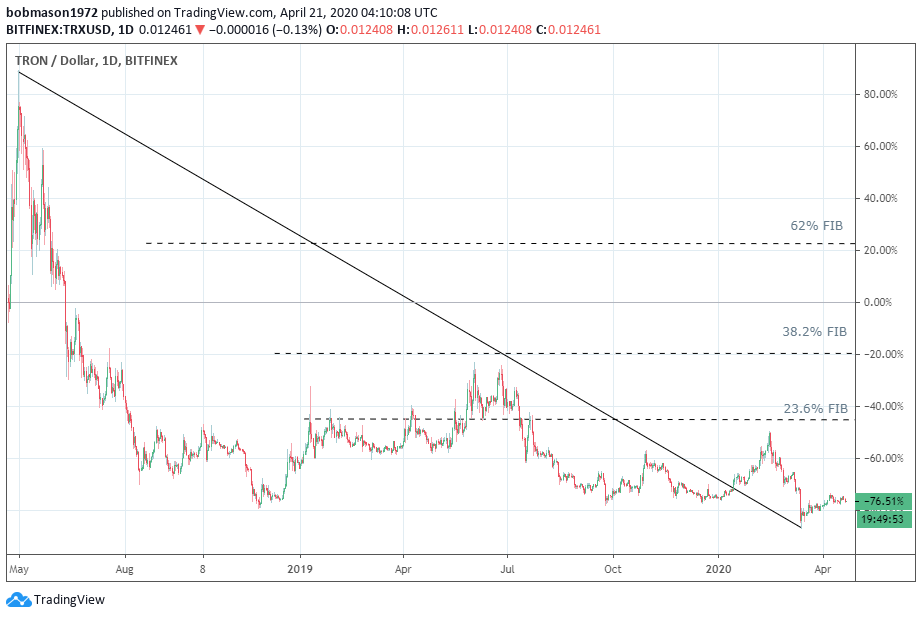
Tron’s TRX slid by 3.38% on Monday. Reversing a 3.42% fall from Sunday, Tron’s TRX ended the day at $0.012477.
A bullish start to the day saw Tron’s TRX rise to an early morning intraday high $0.013180 before hitting reverse.
Falling short of the first major resistance level at $0.01333, Tron’s TRX tumbled to a late intraday low $0.012231.
Tron’s TRX fell through the first major support level at $0.01272 and the second major support level at $0.01246.
Finding late support, Tron’s TRX broke back through the second major support level to wrap up the day at $0.01247 levels.
At the time of writing, Tron’s TRX was down by 0.13% to $0.012451. It was a mixed start to the day. Tron’s TRX rose from an early morning low $0.012408 to a high $0.012611 before easing back.
Tron’s TRX left the major support and resistance levels untested early on.

For the Day Ahead
Tron’s TRX would need to move through to $0.01265 levels to support a run at the first major resistance level at $0.01303.
Support from the broader market would be needed, however, for Tron’s TRX to break out from the morning high $0.012611.
Barring a crypto rally, the first major resistance level at $0.01303 would likely limit any upside.
Failure to move through to $0.01265 could see Tron’s TRX see red for a 3rd consecutive day.
A fall back through the morning low $0.012408 would bring the first major support level at $0.01208 into play.
Barring an extended crypto sell-off, however, Tron’s TRX should steer clear of the second major support level at $0.01168.
Looking at the Technical Indicators
Major Support Level: $0.01208
Major Resistance Level: $0.01358
23.6% FIB Retracement Level: $0.0322
38.2% FIB Retracement Level: $0.0452
62% FIB Retracement Level: $0.0663
Please let us know what you think in the comments below
Thanks, Bob
This article was originally posted on FX Empire

 Yahoo Finance