
 Yahoo Finance
 Such Is Life: How Nippon Dragon Resources (CVE:NIP) Shareholders Saw Their Shares Drop 63%

While not a mind-blowing move, it is good to see that the Nippon Dragon Resources Inc. (CVE:NIP) share price has gained 20% in the last three months. But don't envy holders -- looking back over 5 years the returns have been really bad. Indeed, the share price is down 63% in the period. Some might say the recent bounce is to be expected after such a bad drop. But it could be that the fall was overdone.
Check out our latest analysis for Nippon Dragon Resources
We don't think Nippon Dragon Resources's revenue of CA$148,368 is enough to establish significant demand. You have to wonder why venture capitalists aren't funding it. As a result, we think it's unlikely shareholders are paying much attention to current revenue, but rather speculating on growth in the years to come. For example, investors may be hoping that Nippon Dragon Resources finds some valuable resources, before it runs out of money.
As a general rule, if a company doesn't have much revenue, and it loses money, then it is a high risk investment. You should be aware that there is always a chance that this sort of company will need to issue more shares to raise money to continue pursuing its business plan. While some such companies do very well over the long term, others become hyped up by promoters before eventually falling back down to earth, and going bankrupt (or being recapitalized). Nippon Dragon Resources has already given some investors a taste of the bitter losses that high risk investing can cause.
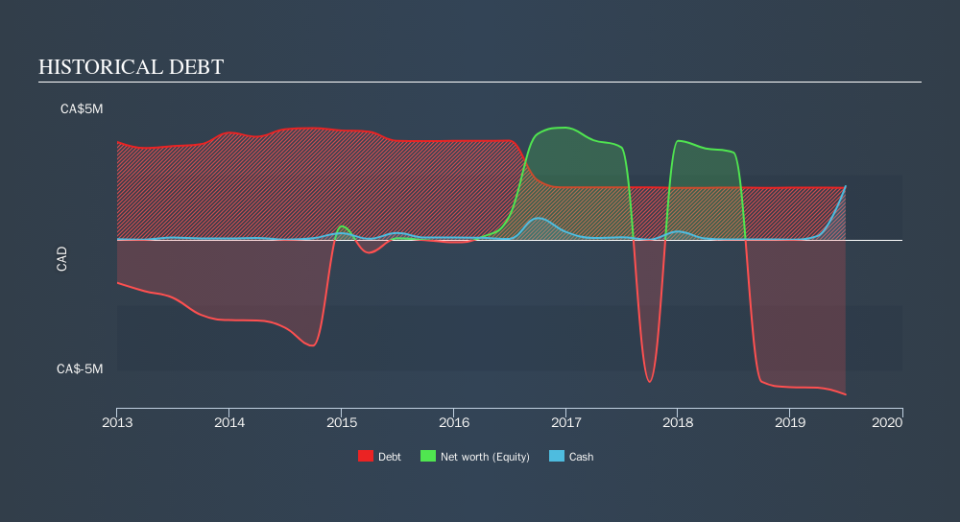
Our data indicates that Nippon Dragon Resources had CA$6.2m more in total liabilities than it had cash, when it last reported in June 2019. That puts it in the highest risk category, according to our analysis. But since the share price has dived -18% per year, over 5 years , it looks like some investors think it's time to abandon ship, so to speak. You can click on the image below to see (in greater detail) how Nippon Dragon Resources's cash levels have changed over time. You can click on the image below to see (in greater detail) how Nippon Dragon Resources's cash levels have changed over time.
It can be extremely risky to invest in a company that doesn't even have revenue. There's no way to know its value easily. Given that situation, would you be concerned if it turned out insiders were relentlessly selling stock? I would feel more nervous about the company if that were so. You can click here to see if there are insiders selling.
A Different Perspective
It's good to see that Nippon Dragon Resources has rewarded shareholders with a total shareholder return of 50% in the last twelve months. That certainly beats the loss of about 18% per year over the last half decade. This makes us a little wary, but the business might have turned around its fortunes. Before spending more time on Nippon Dragon Resources it might be wise to click here to see if insiders have been buying or selling shares.
For those who like to find winning investments this free list of growing companies with recent insider purchasing, could be just the ticket.
Please note, the market returns quoted in this article reflect the market weighted average returns of stocks that currently trade on CA exchanges.
We aim to bring you long-term focused research analysis driven by fundamental data. Note that our analysis may not factor in the latest price-sensitive company announcements or qualitative material.
If you spot an error that warrants correction, please contact the editor at editorial-team@simplywallst.com. This article by Simply Wall St is general in nature. It does not constitute a recommendation to buy or sell any stock, and does not take account of your objectives, or your financial situation. Simply Wall St has no position in the stocks mentioned. Thank you for reading.
