
 Yahoo Finance
 Leslie's (NASDAQ:LESL) May Have Issues Allocating Its Capital
To find a multi-bagger stock, what are the underlying trends we should look for in a business? In a perfect world, we'd like to see a company investing more capital into its business and ideally the returns earned from that capital are also increasing. If you see this, it typically means it's a company with a great business model and plenty of profitable reinvestment opportunities. In light of that, when we looked at Leslie's (NASDAQ:LESL) and its ROCE trend, we weren't exactly thrilled.
Return On Capital Employed (ROCE): What Is It?
For those who don't know, ROCE is a measure of a company's yearly pre-tax profit (its return), relative to the capital employed in the business. To calculate this metric for Leslie's, this is the formula:
Return on Capital Employed = Earnings Before Interest and Tax (EBIT) ÷ (Total Assets - Current Liabilities)
0.13 = US$104m ÷ (US$999m - US$205m) (Based on the trailing twelve months to December 2023).
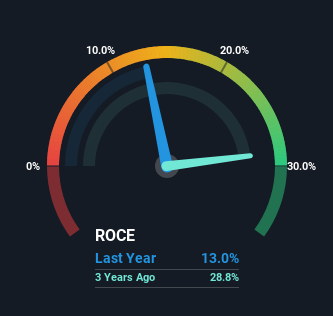
Thus, Leslie's has an ROCE of 13%. In absolute terms, that's a pretty normal return, and it's somewhat close to the Specialty Retail industry average of 14%.
Check out our latest analysis for Leslie's
In the above chart we have measured Leslie's' prior ROCE against its prior performance, but the future is arguably more important. If you'd like, you can check out the forecasts from the analysts covering Leslie's for free.
What Does the ROCE Trend For Leslie's Tell Us?
On the surface, the trend of ROCE at Leslie's doesn't inspire confidence. Over the last five years, returns on capital have decreased to 13% from 37% five years ago. Meanwhile, the business is utilizing more capital but this hasn't moved the needle much in terms of sales in the past 12 months, so this could reflect longer term investments. It's worth keeping an eye on the company's earnings from here on to see if these investments do end up contributing to the bottom line.
On a side note, Leslie's has done well to pay down its current liabilities to 20% of total assets. So we could link some of this to the decrease in ROCE. Effectively this means their suppliers or short-term creditors are funding less of the business, which reduces some elements of risk. Some would claim this reduces the business' efficiency at generating ROCE since it is now funding more of the operations with its own money.
What We Can Learn From Leslie's' ROCE
To conclude, we've found that Leslie's is reinvesting in the business, but returns have been falling. And investors appear hesitant that the trends will pick up because the stock has fallen 64% in the last three years. In any case, the stock doesn't have these traits of a multi-bagger discussed above, so if that's what you're looking for, we think you'd have more luck elsewhere.
Leslie's does come with some risks though, we found 5 warning signs in our investment analysis, and 2 of those are significant...
If you want to search for solid companies with great earnings, check out this free list of companies with good balance sheets and impressive returns on equity.
Have feedback on this article? Concerned about the content? Get in touch with us directly. Alternatively, email editorial-team (at) simplywallst.com.
This article by Simply Wall St is general in nature. We provide commentary based on historical data and analyst forecasts only using an unbiased methodology and our articles are not intended to be financial advice. It does not constitute a recommendation to buy or sell any stock, and does not take account of your objectives, or your financial situation. We aim to bring you long-term focused analysis driven by fundamental data. Note that our analysis may not factor in the latest price-sensitive company announcements or qualitative material. Simply Wall St has no position in any stocks mentioned.
