
 Yahoo Finance
 What Can We Learn From TVA Group Inc.’s (TSE:TVA.B) Investment Returns?

Today we'll look at TVA Group Inc. (TSE:TVA.B) and reflect on its potential as an investment. In particular, we'll consider its Return On Capital Employed (ROCE), as that can give us insight into how profitably the company is able to employ capital in its business.
First of all, we'll work out how to calculate ROCE. Then we'll compare its ROCE to similar companies. Finally, we'll look at how its current liabilities affect its ROCE.
What is Return On Capital Employed (ROCE)?
ROCE is a measure of a company's yearly pre-tax profit (its return), relative to the capital employed in the business. In general, businesses with a higher ROCE are usually better quality. Overall, it is a valuable metric that has its flaws. Author Edwin Whiting says to be careful when comparing the ROCE of different businesses, since 'No two businesses are exactly alike.
So, How Do We Calculate ROCE?
The formula for calculating the return on capital employed is:
Return on Capital Employed = Earnings Before Interest and Tax (EBIT) ÷ (Total Assets - Current Liabilities)
Or for TVA Group:
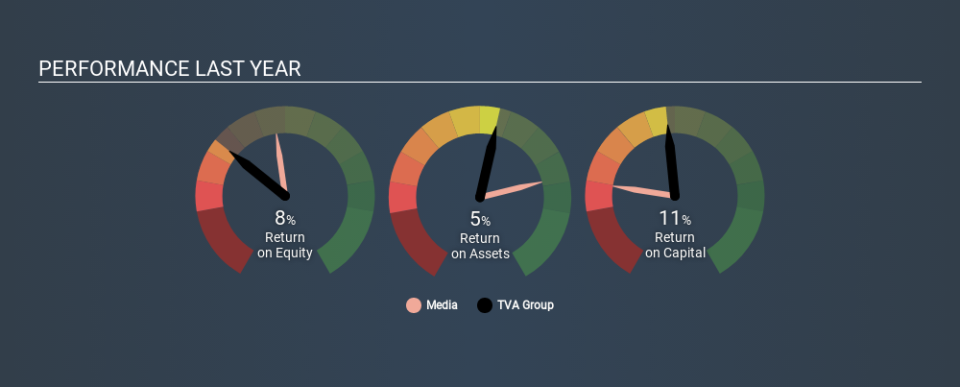
0.11 = CA$37m ÷ (CA$566m - CA$240m) (Based on the trailing twelve months to March 2020.)
Therefore, TVA Group has an ROCE of 11%.
See our latest analysis for TVA Group
Is TVA Group's ROCE Good?
When making comparisons between similar businesses, investors may find ROCE useful. Using our data, TVA Group's ROCE appears to be around the 9.8% average of the Media industry. Independently of how TVA Group compares to its industry, its ROCE in absolute terms appears decent, and the company may be worthy of closer investigation.
Our data shows that TVA Group currently has an ROCE of 11%, compared to its ROCE of 2.3% 3 years ago. This makes us think about whether the company has been reinvesting shrewdly. The image below shows how TVA Group's ROCE compares to its industry, and you can click it to see more detail on its past growth.
It is important to remember that ROCE shows past performance, and is not necessarily predictive. ROCE can be misleading for companies in cyclical industries, with returns looking impressive during the boom times, but very weak during the busts. This is because ROCE only looks at one year, instead of considering returns across a whole cycle. Since the future is so important for investors, you should check out our free report on analyst forecasts for TVA Group.
How TVA Group's Current Liabilities Impact Its ROCE
Current liabilities include invoices, such as supplier payments, short-term debt, or a tax bill, that need to be paid within 12 months. Due to the way ROCE is calculated, a high level of current liabilities makes a company look as though it has less capital employed, and thus can (sometimes unfairly) boost the ROCE. To check the impact of this, we calculate if a company has high current liabilities relative to its total assets.
TVA Group has current liabilities of CA$240m and total assets of CA$566m. Therefore its current liabilities are equivalent to approximately 42% of its total assets. TVA Group has a medium level of current liabilities, which would boost the ROCE.
The Bottom Line On TVA Group's ROCE
With a decent ROCE, the company could be interesting, but remember that the level of current liabilities make the ROCE look better. TVA Group looks strong on this analysis, but there are plenty of other companies that could be a good opportunity . Here is a free list of companies growing earnings rapidly.
I will like TVA Group better if I see some big insider buys. While we wait, check out this free list of growing companies with considerable, recent, insider buying.
Love or hate this article? Concerned about the content? Get in touch with us directly. Alternatively, email editorial-team@simplywallst.com.
This article by Simply Wall St is general in nature. It does not constitute a recommendation to buy or sell any stock, and does not take account of your objectives, or your financial situation. We aim to bring you long-term focused analysis driven by fundamental data. Note that our analysis may not factor in the latest price-sensitive company announcements or qualitative material. Simply Wall St has no position in any stocks mentioned. Thank you for reading.
