
 Yahoo Finance
 The Lear (NYSE:LEA) Share Price Is Up 58% And Shareholders Are Holding On
The main point of investing for the long term is to make money. Furthermore, you'd generally like to see the share price rise faster than the market Unfortunately for shareholders, while the Lear Corporation (NYSE:LEA) share price is up 58% in the last five years, that's less than the market return. Over the last twelve months the stock price has risen a very respectable 14%.
See our latest analysis for Lear
In his essay The Superinvestors of Graham-and-Doddsville Warren Buffett described how share prices do not always rationally reflect the value of a business. One flawed but reasonable way to assess how sentiment around a company has changed is to compare the earnings per share (EPS) with the share price.
Lear's earnings per share are down 29% per year, despite strong share price performance over five years.
This means it's unlikely the market is judging the company based on earnings growth. Because earnings per share don't seem to match up with the share price, we'll take a look at other metrics instead.
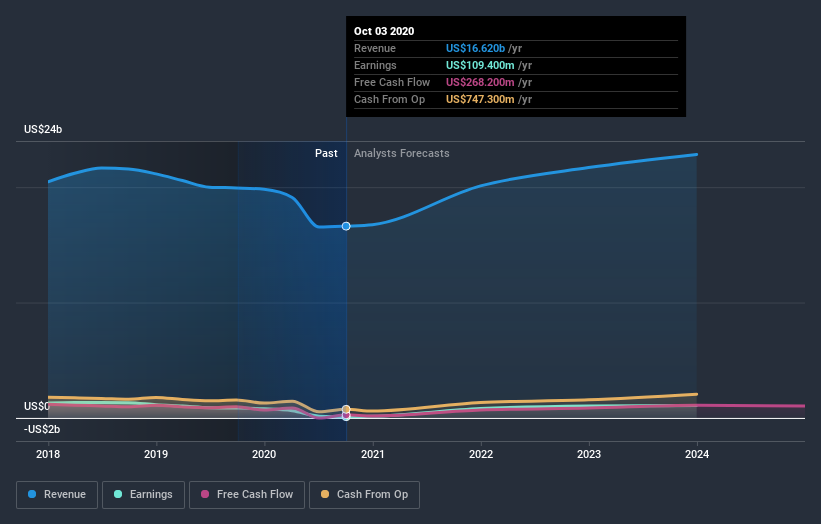
The modest 0.6% dividend yield is unlikely to be propping up the share price. We are not particularly impressed by the annual compound revenue growth of 0.5% over five years. So it seems one might have to take closer look at earnings and revenue trends to see how they might influence the share price.
You can see below how earnings and revenue have changed over time (discover the exact values by clicking on the image).
Lear is well known by investors, and plenty of clever analysts have tried to predict the future profit levels. So we recommend checking out this free report showing consensus forecasts
What About Dividends?
As well as measuring the share price return, investors should also consider the total shareholder return (TSR). Whereas the share price return only reflects the change in the share price, the TSR includes the value of dividends (assuming they were reinvested) and the benefit of any discounted capital raising or spin-off. Arguably, the TSR gives a more comprehensive picture of the return generated by a stock. As it happens, Lear's TSR for the last 5 years was 69%, which exceeds the share price return mentioned earlier. This is largely a result of its dividend payments!
A Different Perspective
Lear provided a TSR of 15% over the last twelve months. But that was short of the market average. On the bright side, that's still a gain, and it's actually better than the average return of 11% over half a decade This suggests the company might be improving over time. I find it very interesting to look at share price over the long term as a proxy for business performance. But to truly gain insight, we need to consider other information, too. Take risks, for example - Lear has 3 warning signs we think you should be aware of.
But note: Lear may not be the best stock to buy. So take a peek at this free list of interesting companies with past earnings growth (and further growth forecast).
Please note, the market returns quoted in this article reflect the market weighted average returns of stocks that currently trade on US exchanges.
This article by Simply Wall St is general in nature. It does not constitute a recommendation to buy or sell any stock, and does not take account of your objectives, or your financial situation. We aim to bring you long-term focused analysis driven by fundamental data. Note that our analysis may not factor in the latest price-sensitive company announcements or qualitative material. Simply Wall St has no position in any stocks mentioned.
Have feedback on this article? Concerned about the content? Get in touch with us directly. Alternatively, email editorial-team (at) simplywallst.com.