
 Yahoo Finance
 Is Lear Corporation (NYSE:LEA) A Financially Sound Company?

Want to participate in a short research study? Help shape the future of investing tools and you could win a $250 gift card!
Small-caps and large-caps are wildly popular among investors, however, mid-cap stocks, such as Lear Corporation (NYSE:LEA), with a market capitalization of US$8.4b, rarely draw their attention from the investing community. While they are less talked about as an investment category, mid-cap risk-adjusted returns have generally been better than more commonly focused stocks that fall into the small- or large-cap categories. This article will examine LEA’s financial liquidity and debt levels to get an idea of whether the company can deal with cyclical downturns and maintain funds to accommodate strategic spending for future growth. Note that this commentary is very high-level and solely focused on financial health, so I suggest you dig deeper yourself into LEA here.
See our latest analysis for Lear
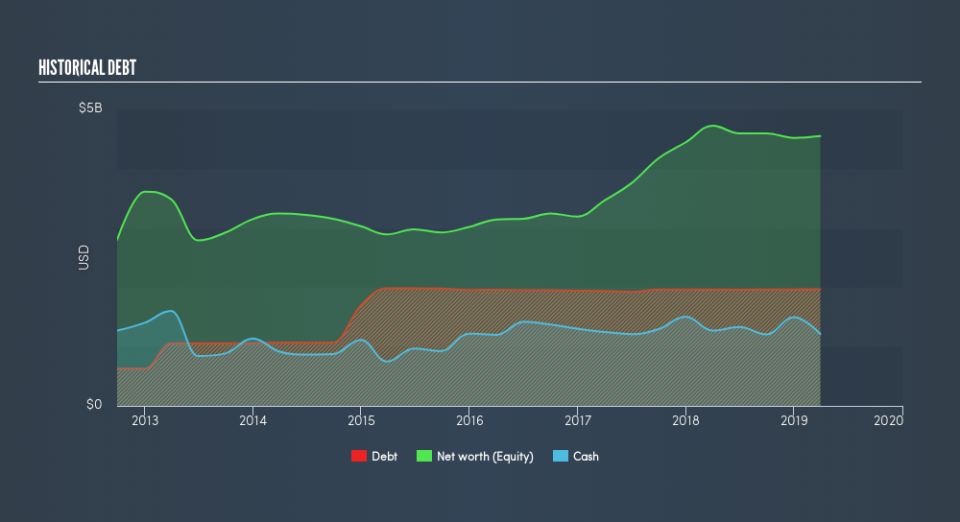
Does LEA Produce Much Cash Relative To Its Debt?
LEA's debt levels surged from US$2.0b to US$2.4b over the last 12 months – this includes long-term debt. With this growth in debt, LEA currently has US$1.2b remaining in cash and short-term investments to keep the business going. Moreover, LEA has generated cash from operations of US$1.6b during the same period of time, leading to an operating cash to total debt ratio of 66%, signalling that LEA’s current level of operating cash is high enough to cover debt.
Can LEA pay its short-term liabilities?
Looking at LEA’s US$4.9b in current liabilities, the company has maintained a safe level of current assets to meet its obligations, with the current ratio last standing at 1.34x. The current ratio is the number you get when you divide current assets by current liabilities. Usually, for Auto Components companies, this is a suitable ratio since there is a bit of a cash buffer without leaving too much capital in a low-return environment.
Does LEA face the risk of succumbing to its debt-load?
With a debt-to-equity ratio of 43%, LEA can be considered as an above-average leveraged company. This is not uncommon for a mid-cap company given that debt tends to be lower-cost and at times, more accessible. We can check to see whether LEA is able to meet its debt obligations by looking at the net interest coverage ratio. A company generating earnings before interest and tax (EBIT) at least three times its net interest payments is considered financially sound. In LEA's, case, the ratio of 19.28x suggests that interest is comfortably covered, which means that lenders may be less hesitant to lend out more funding as LEA’s high interest coverage is seen as responsible and safe practice.
Next Steps:
Although LEA’s debt level is towards the higher end of the spectrum, its cash flow coverage seems adequate to meet obligations which means its debt is being efficiently utilised. Since there is also no concerns around LEA's liquidity needs, this may be its optimal capital structure for the time being. This is only a rough assessment of financial health, and I'm sure LEA has company-specific issues impacting its capital structure decisions. I recommend you continue to research Lear to get a better picture of the mid-cap by looking at:
Future Outlook: What are well-informed industry analysts predicting for LEA’s future growth? Take a look at our free research report of analyst consensus for LEA’s outlook.
Valuation: What is LEA worth today? Is the stock undervalued, even when its growth outlook is factored into its intrinsic value? The intrinsic value infographic in our free research report helps visualize whether LEA is currently mispriced by the market.
Other High-Performing Stocks: Are there other stocks that provide better prospects with proven track records? Explore our free list of these great stocks here.
We aim to bring you long-term focused research analysis driven by fundamental data. Note that our analysis may not factor in the latest price-sensitive company announcements or qualitative material.
If you spot an error that warrants correction, please contact the editor at editorial-team@simplywallst.com. This article by Simply Wall St is general in nature. It does not constitute a recommendation to buy or sell any stock, and does not take account of your objectives, or your financial situation. Simply Wall St has no position in the stocks mentioned. Thank you for reading.
