
 Yahoo Finance
 Lacklustre Performance Is Driving Velan Inc.'s (TSE:VLN) 47% Price Drop
Velan Inc. (TSE:VLN) shareholders that were waiting for something to happen have been dealt a blow with a 47% share price drop in the last month. Looking back over the past twelve months the stock has been a solid performer regardless, with a gain of 12%.
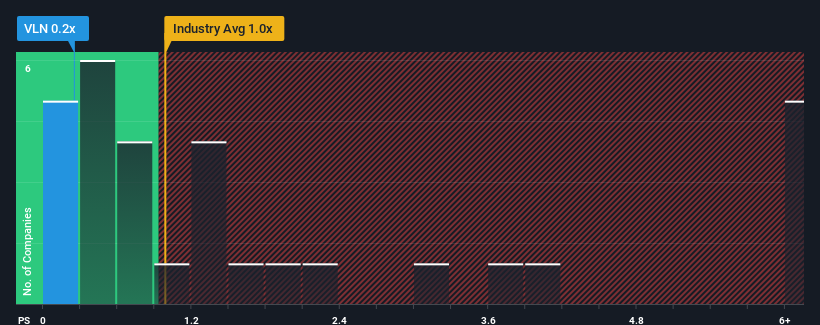
Following the heavy fall in price, given about half the companies operating in Canada's Machinery industry have price-to-sales ratios (or "P/S") above 1x, you may consider Velan as an attractive investment with its 0.2x P/S ratio. Although, it's not wise to just take the P/S at face value as there may be an explanation why it's limited.
See our latest analysis for Velan
How Has Velan Performed Recently?
As an illustration, revenue has deteriorated at Velan over the last year, which is not ideal at all. Perhaps the market believes the recent revenue performance isn't good enough to keep up the industry, causing the P/S ratio to suffer. If you like the company, you'd be hoping this isn't the case so that you could potentially pick up some stock while it's out of favour.
Although there are no analyst estimates available for Velan, take a look at this free data-rich visualisation to see how the company stacks up on earnings, revenue and cash flow.
Do Revenue Forecasts Match The Low P/S Ratio?
There's an inherent assumption that a company should underperform the industry for P/S ratios like Velan's to be considered reasonable.
In reviewing the last year of financials, we were disheartened to see the company's revenues fell to the tune of 9.3%. Unfortunately, that's brought it right back to where it started three years ago with revenue growth being virtually non-existent overall during that time. So it appears to us that the company has had a mixed result in terms of growing revenue over that time.
Comparing that to the industry, which is predicted to deliver 24% growth in the next 12 months, the company's momentum is weaker, based on recent medium-term annualised revenue results.
In light of this, it's understandable that Velan's P/S sits below the majority of other companies. It seems most investors are expecting to see the recent limited growth rates continue into the future and are only willing to pay a reduced amount for the stock.
The Key Takeaway
The southerly movements of Velan's shares means its P/S is now sitting at a pretty low level. Generally, our preference is to limit the use of the price-to-sales ratio to establishing what the market thinks about the overall health of a company.
As we suspected, our examination of Velan revealed its three-year revenue trends are contributing to its low P/S, given they look worse than current industry expectations. Right now shareholders are accepting the low P/S as they concede future revenue probably won't provide any pleasant surprises. Unless the recent medium-term conditions improve, they will continue to form a barrier for the share price around these levels.
Before you settle on your opinion, we've discovered 3 warning signs for Velan (1 makes us a bit uncomfortable!) that you should be aware of.
Of course, profitable companies with a history of great earnings growth are generally safer bets. So you may wish to see this free collection of other companies that have reasonable P/E ratios and have grown earnings strongly.
Have feedback on this article? Concerned about the content? Get in touch with us directly. Alternatively, email editorial-team (at) simplywallst.com.
This article by Simply Wall St is general in nature. We provide commentary based on historical data and analyst forecasts only using an unbiased methodology and our articles are not intended to be financial advice. It does not constitute a recommendation to buy or sell any stock, and does not take account of your objectives, or your financial situation. We aim to bring you long-term focused analysis driven by fundamental data. Note that our analysis may not factor in the latest price-sensitive company announcements or qualitative material. Simply Wall St has no position in any stocks mentioned.
