
 Yahoo Finance
 Kyndryl Holdings (NYSE:KD) Is Experiencing Growth In Returns On Capital
What are the early trends we should look for to identify a stock that could multiply in value over the long term? Firstly, we'd want to identify a growing return on capital employed (ROCE) and then alongside that, an ever-increasing base of capital employed. If you see this, it typically means it's a company with a great business model and plenty of profitable reinvestment opportunities. Speaking of which, we noticed some great changes in Kyndryl Holdings' (NYSE:KD) returns on capital, so let's have a look.
Understanding Return On Capital Employed (ROCE)
If you haven't worked with ROCE before, it measures the 'return' (pre-tax profit) a company generates from capital employed in its business. To calculate this metric for Kyndryl Holdings, this is the formula:
Return on Capital Employed = Earnings Before Interest and Tax (EBIT) ÷ (Total Assets - Current Liabilities)
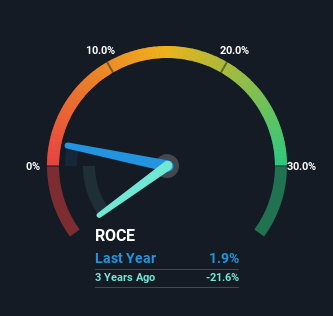
0.019 = US$116m ÷ (US$11b - US$4.6b) (Based on the trailing twelve months to March 2024).
So, Kyndryl Holdings has an ROCE of 1.9%. Ultimately, that's a low return and it under-performs the IT industry average of 11%.
View our latest analysis for Kyndryl Holdings
In the above chart we have measured Kyndryl Holdings' prior ROCE against its prior performance, but the future is arguably more important. If you'd like, you can check out the forecasts from the analysts covering Kyndryl Holdings for free.
What Does the ROCE Trend For Kyndryl Holdings Tell Us?
It's great to see that Kyndryl Holdings has started to generate some pre-tax earnings from prior investments. Historically the company was generating losses but as we can see from the latest figures referenced above, they're now earning 1.9% on their capital employed. Additionally, the business is utilizing 26% less capital than it was four years ago, and taken at face value, that can mean the company needs less funds at work to get a return. The reduction could indicate that the company is selling some assets, and considering returns are up, they appear to be selling the right ones.
For the record though, there was a noticeable increase in the company's current liabilities over the period, so we would attribute some of the ROCE growth to that. The current liabilities has increased to 43% of total assets, so the business is now more funded by the likes of its suppliers or short-term creditors. Given it's pretty high ratio, we'd remind investors that having current liabilities at those levels can bring about some risks in certain businesses.
The Bottom Line
In a nutshell, we're pleased to see that Kyndryl Holdings has been able to generate higher returns from less capital. And with the stock having performed exceptionally well over the last year, these patterns are being accounted for by investors. So given the stock has proven it has promising trends, it's worth researching the company further to see if these trends are likely to persist.
Before jumping to any conclusions though, we need to know what value we're getting for the current share price. That's where you can check out our FREE intrinsic value estimation for KD that compares the share price and estimated value.
If you want to search for solid companies with great earnings, check out this free list of companies with good balance sheets and impressive returns on equity.
Have feedback on this article? Concerned about the content? Get in touch with us directly. Alternatively, email editorial-team (at) simplywallst.com.
This article by Simply Wall St is general in nature. We provide commentary based on historical data and analyst forecasts only using an unbiased methodology and our articles are not intended to be financial advice. It does not constitute a recommendation to buy or sell any stock, and does not take account of your objectives, or your financial situation. We aim to bring you long-term focused analysis driven by fundamental data. Note that our analysis may not factor in the latest price-sensitive company announcements or qualitative material. Simply Wall St has no position in any stocks mentioned.
Have feedback on this article? Concerned about the content? Get in touch with us directly. Alternatively, email editorial-team@simplywallst.com
