
 Yahoo Finance
 KUKA Aktiengesellschaft (ETR:KU2) Stock Is Going Strong But Fundamentals Look Uncertain: What Lies Ahead ?

KUKA (ETR:KU2) has had a great run on the share market with its stock up by a significant 50% over the last month. However, we wonder if the company's inconsistent financials would have any adverse impact on the current share price momentum. Particularly, we will be paying attention to KUKA's ROE today.
Return on Equity or ROE is a test of how effectively a company is growing its value and managing investors’ money. In short, ROE shows the profit each dollar generates with respect to its shareholder investments.
View our latest analysis for KUKA
How Is ROE Calculated?
The formula for return on equity is:
Return on Equity = Net Profit (from continuing operations) ÷ Shareholders' Equity
So, based on the above formula, the ROE for KUKA is:
1.3% = €18m ÷ €1.3b (Based on the trailing twelve months to December 2019).
The 'return' refers to a company's earnings over the last year. So, this means that for every €1 of its shareholder's investments, the company generates a profit of €0.01.
What Has ROE Got To Do With Earnings Growth?
Thus far, we have learnt that ROE measures how efficiently a company is generating its profits. Based on how much of its profits the company chooses to reinvest or "retain", we are then able to evaluate a company's future ability to generate profits. Generally speaking, other things being equal, firms with a high return on equity and profit retention, have a higher growth rate than firms that don’t share these attributes.
KUKA's Earnings Growth And 1.3% ROE
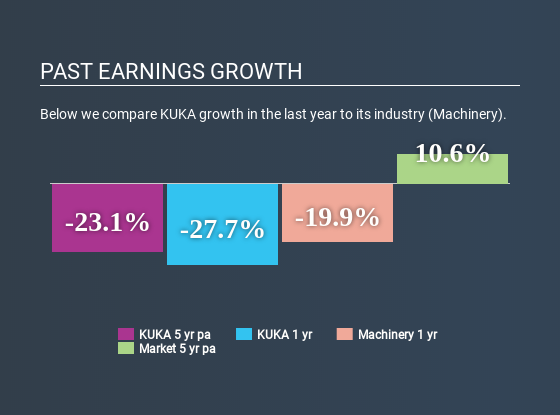
It is hard to argue that KUKA's ROE is much good in and of itself. Even when compared to the industry average of 10%, the ROE figure is pretty disappointing. For this reason, KUKA's five year net income decline of 23% is not surprising given its lower ROE. We reckon that there could also be other factors at play here. For example, the business has allocated capital poorly, or that the company has a very high payout ratio.
That being said, we compared KUKA's performance with the industry and were concerned when we found that while the company has shrunk its earnings, the industry has grown its earnings at a rate of 11% in the same period.
Earnings growth is a huge factor in stock valuation. The investor should try to establish if the expected growth or decline in earnings, whichever the case may be, is priced in. This then helps them determine if the stock is placed for a bright or bleak future. One good indicator of expected earnings growth is the P/E ratio which determines the price the market is willing to pay for a stock based on its earnings prospects. So, you may want to check if KUKA is trading on a high P/E or a low P/E, relative to its industry.
Is KUKA Using Its Retained Earnings Effectively?
When we piece together KUKA's low three-year median payout ratio of 20% (where it is retaining 80% of its profits), calculated for the last three-year period, we are puzzled by the lack of growth. The low payout should mean that the company is retaining most of its earnings and consequently, should see some growth. So there could be some other explanations in that regard. For example, the company's business may be deteriorating.
Moreover, KUKA has been paying dividends for seven years, which is a considerable amount of time, suggesting that management must have perceived that the shareholders prefer consistent dividends even though earnings have been shrinking. Looking at the current analyst consensus data, we can see that the company's future payout ratio is expected to rise to 89% over the next three years. Despite the higher expected payout ratio, the company's ROE is not expected to change by much.
Conclusion
In total, we're a bit ambivalent about KUKA's performance. While the company does have a high rate of reinvestment, the low ROE means that all that reinvestment is not reaping any benefit to its investors, and moreover, its having a negative impact on the earnings growth. Having said that, looking at current analyst estimates, we found that the company's earnings growth rate is expected to see a huge improvement. Are these analysts expectations based on the broad expectations for the industry, or on the company's fundamentals? Click here to be taken to our analyst's forecasts page for the company.
If you spot an error that warrants correction, please contact the editor at editorial-team@simplywallst.com. This article by Simply Wall St is general in nature. It does not constitute a recommendation to buy or sell any stock, and does not take account of your objectives, or your financial situation. Simply Wall St has no position in the stocks mentioned.
We aim to bring you long-term focused research analysis driven by fundamental data. Note that our analysis may not factor in the latest price-sensitive company announcements or qualitative material. Thank you for reading.
