
 Yahoo Finance
 Koenig & Bauer (ETR:SKB) Will Want To Turn Around Its Return Trends
If you're not sure where to start when looking for the next multi-bagger, there are a few key trends you should keep an eye out for. Firstly, we'll want to see a proven return on capital employed (ROCE) that is increasing, and secondly, an expanding base of capital employed. Put simply, these types of businesses are compounding machines, meaning they are continually reinvesting their earnings at ever-higher rates of return. In light of that, when we looked at Koenig & Bauer (ETR:SKB) and its ROCE trend, we weren't exactly thrilled.
Return On Capital Employed (ROCE): What Is It?
For those who don't know, ROCE is a measure of a company's yearly pre-tax profit (its return), relative to the capital employed in the business. Analysts use this formula to calculate it for Koenig & Bauer:
Return on Capital Employed = Earnings Before Interest and Tax (EBIT) ÷ (Total Assets - Current Liabilities)
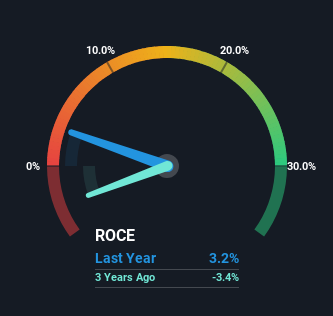
0.032 = €25m ÷ (€1.5b - €739m) (Based on the trailing twelve months to September 2023).
Therefore, Koenig & Bauer has an ROCE of 3.2%. In absolute terms, that's a low return and it also under-performs the Machinery industry average of 11%.
View our latest analysis for Koenig & Bauer
Above you can see how the current ROCE for Koenig & Bauer compares to its prior returns on capital, but there's only so much you can tell from the past. If you'd like, you can check out the forecasts from the analysts covering Koenig & Bauer for free.
What Can We Tell From Koenig & Bauer's ROCE Trend?
When we looked at the ROCE trend at Koenig & Bauer, we didn't gain much confidence. Over the last five years, returns on capital have decreased to 3.2% from 10.0% five years ago. However, given capital employed and revenue have both increased it appears that the business is currently pursuing growth, at the consequence of short term returns. If these investments prove successful, this can bode very well for long term stock performance.
On a side note, Koenig & Bauer's current liabilities are still rather high at 49% of total assets. This effectively means that suppliers (or short-term creditors) are funding a large portion of the business, so just be aware that this can introduce some elements of risk. While it's not necessarily a bad thing, it can be beneficial if this ratio is lower.
In Conclusion...
Even though returns on capital have fallen in the short term, we find it promising that revenue and capital employed have both increased for Koenig & Bauer. But since the stock has dived 75% in the last five years, there could be other drivers that are influencing the business' outlook. Therefore, we'd suggest researching the stock further to uncover more about the business.
Koenig & Bauer could be trading at an attractive price in other respects, so you might find our free intrinsic value estimation for SKB on our platform quite valuable.
While Koenig & Bauer isn't earning the highest return, check out this free list of companies that are earning high returns on equity with solid balance sheets.
Have feedback on this article? Concerned about the content? Get in touch with us directly. Alternatively, email editorial-team (at) simplywallst.com.
This article by Simply Wall St is general in nature. We provide commentary based on historical data and analyst forecasts only using an unbiased methodology and our articles are not intended to be financial advice. It does not constitute a recommendation to buy or sell any stock, and does not take account of your objectives, or your financial situation. We aim to bring you long-term focused analysis driven by fundamental data. Note that our analysis may not factor in the latest price-sensitive company announcements or qualitative material. Simply Wall St has no position in any stocks mentioned.
